How we created a friendly chatbot to submit a car insurance claim

Introduction
Insurance providers are aware that the two primary moments when a customer evaluates them are when they purchase the insurance and when they submit a claim.
Tranquilidade is an old-school insurance company in Portugal and was our client for this project. Our stakeholders in Tranquilidade were keen to improve the customer experience of submitting a claimIt was actually a lot more open ended in the beginning, and they wanted to do it through a mobile app (i.e. digitally) to potentially reduce the operational costs involved.
My role
I was embedded in a team of three from Cocoon on this digital transformation project. My role was to conceptualise and design the resulting mobile experience. I collaborated with the project lead, who was a service design expert, and a business analyst who helped with analysis of the problem space.
I was involved with onsite UX research, led the design of the solution, and moderated usability testing sessions.
Our objective
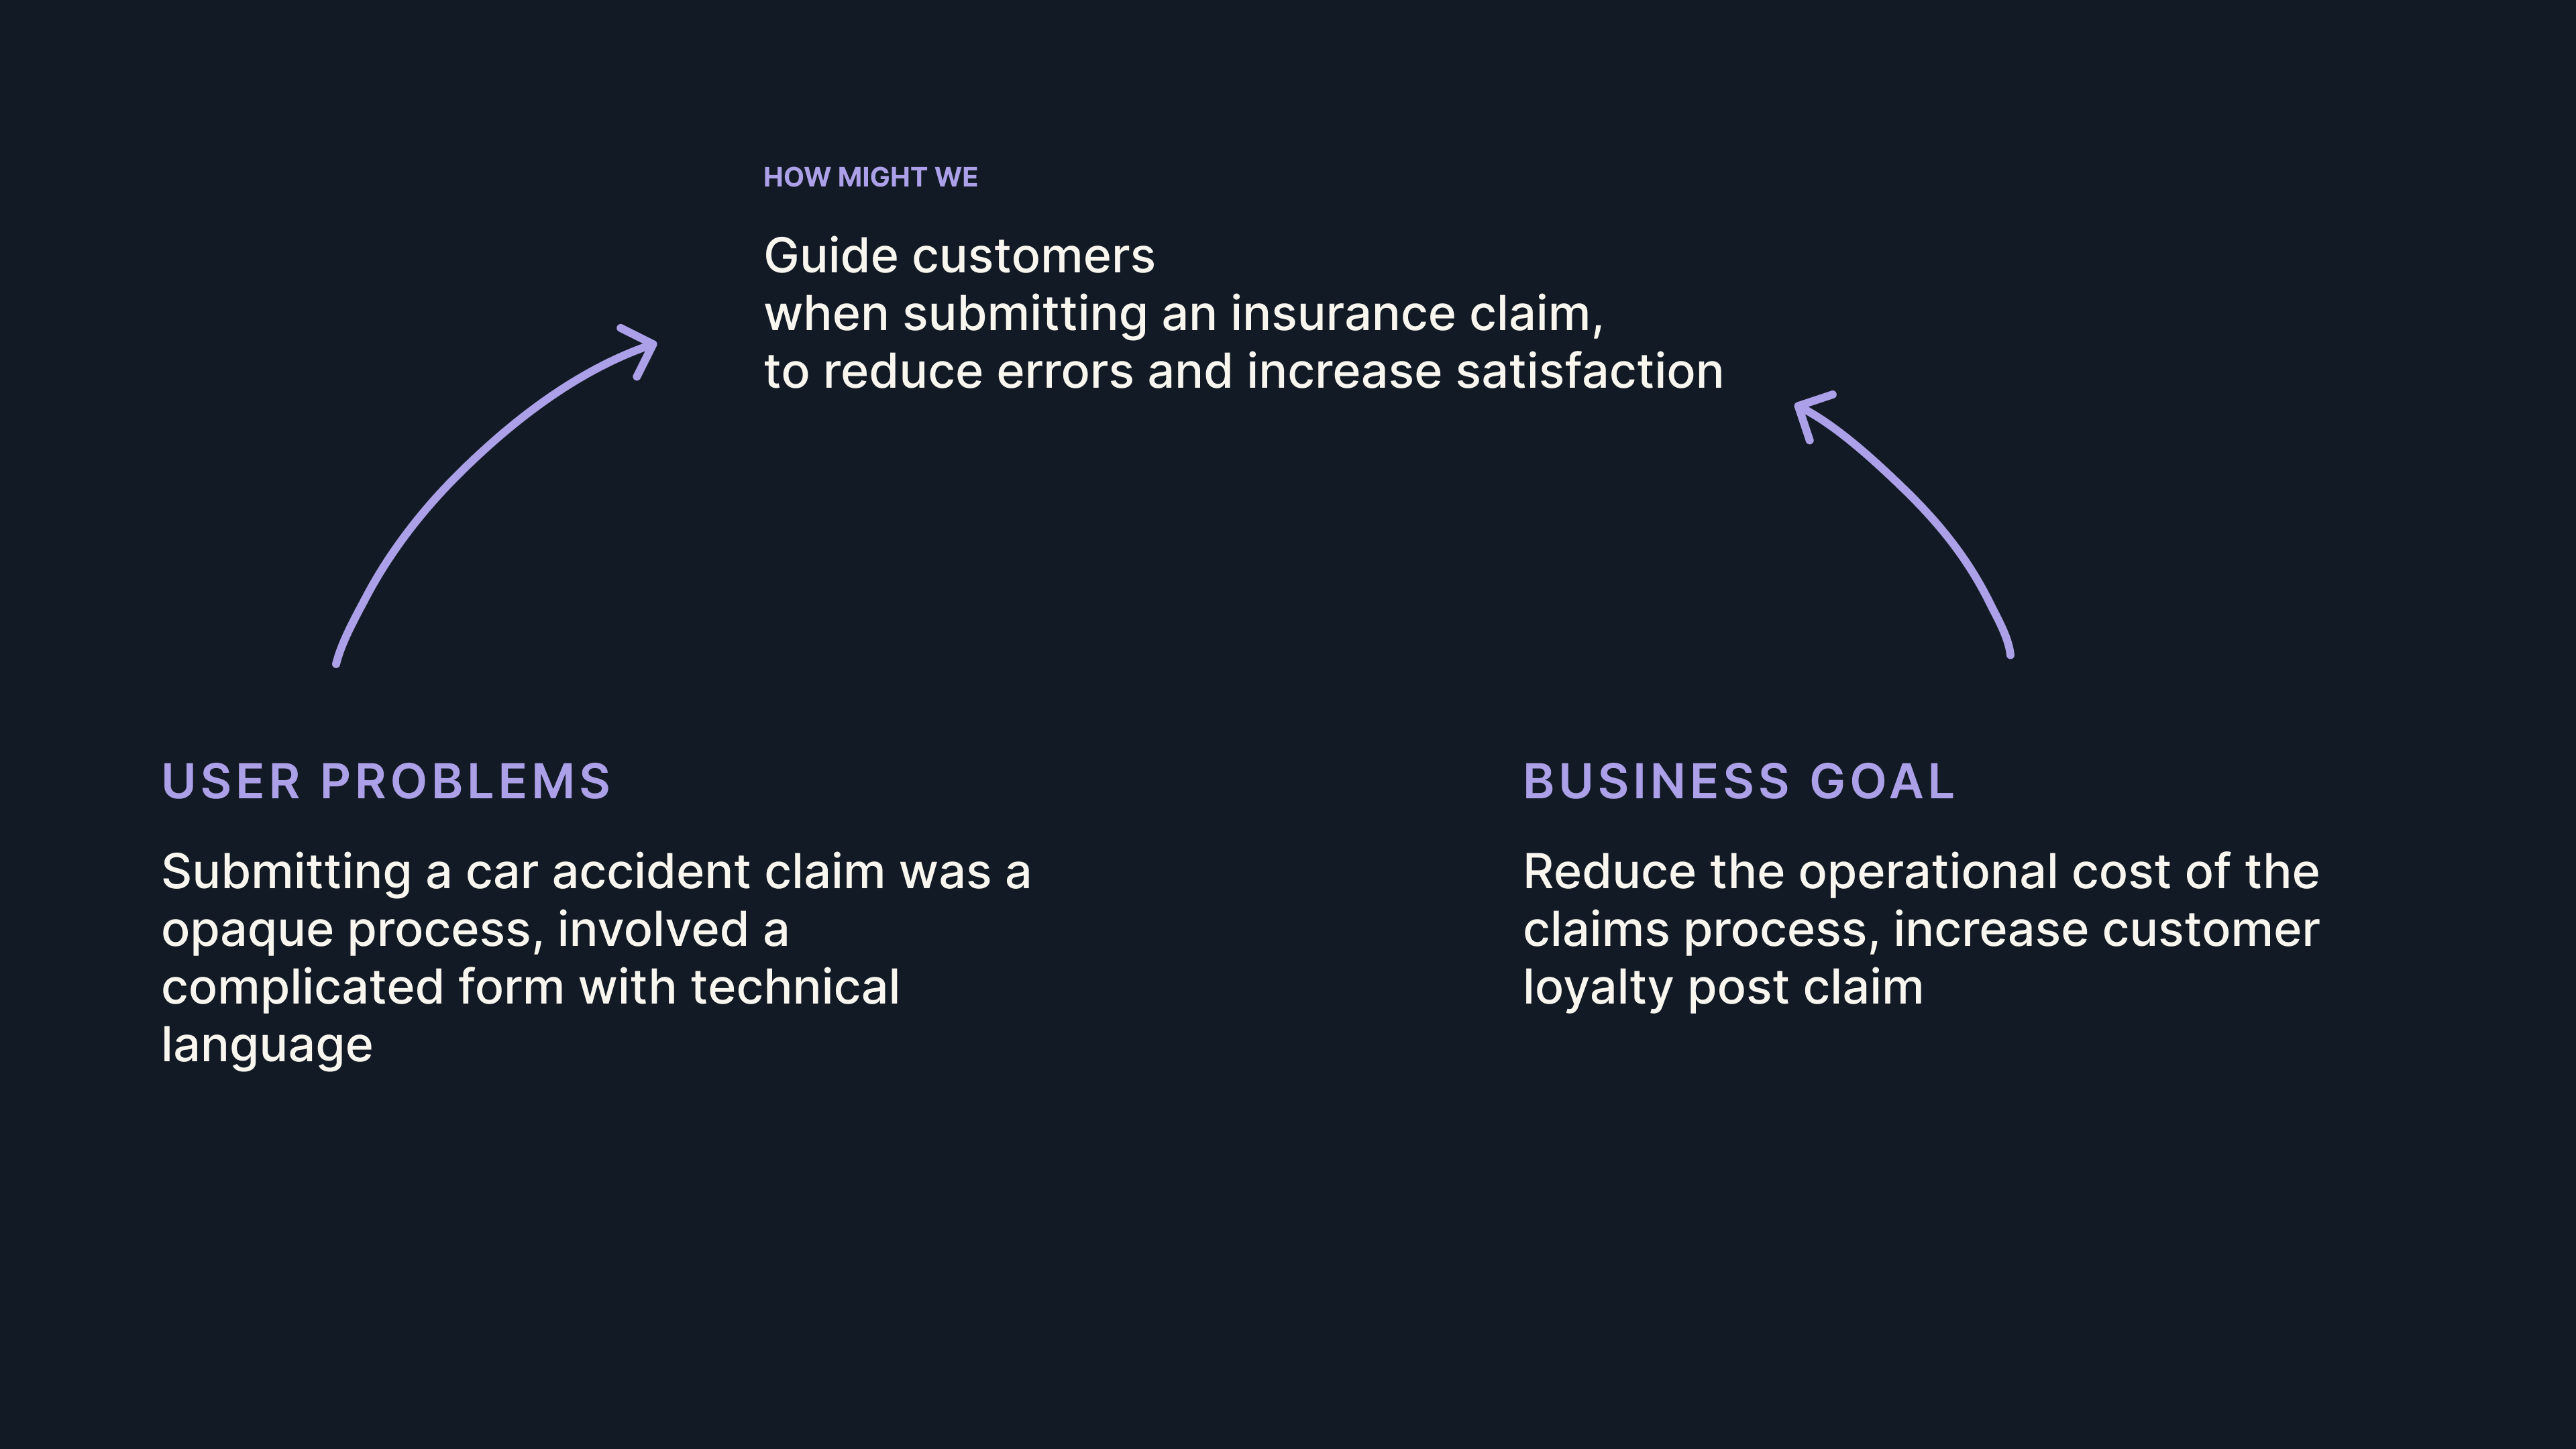
Going through a car accident is an emotionally stressful event with significant life and financial impact. To help customers through this trying time, we wanted to dramatically simplify the process to submit a claim to their insurance provider.
Expectation that the insurance provider ‘has got my back’
By digitally transforming the claims process end to end, we expected to reduce the time taken to process the claim and provide feedback to the customer on its progress.
Mapping the problem space
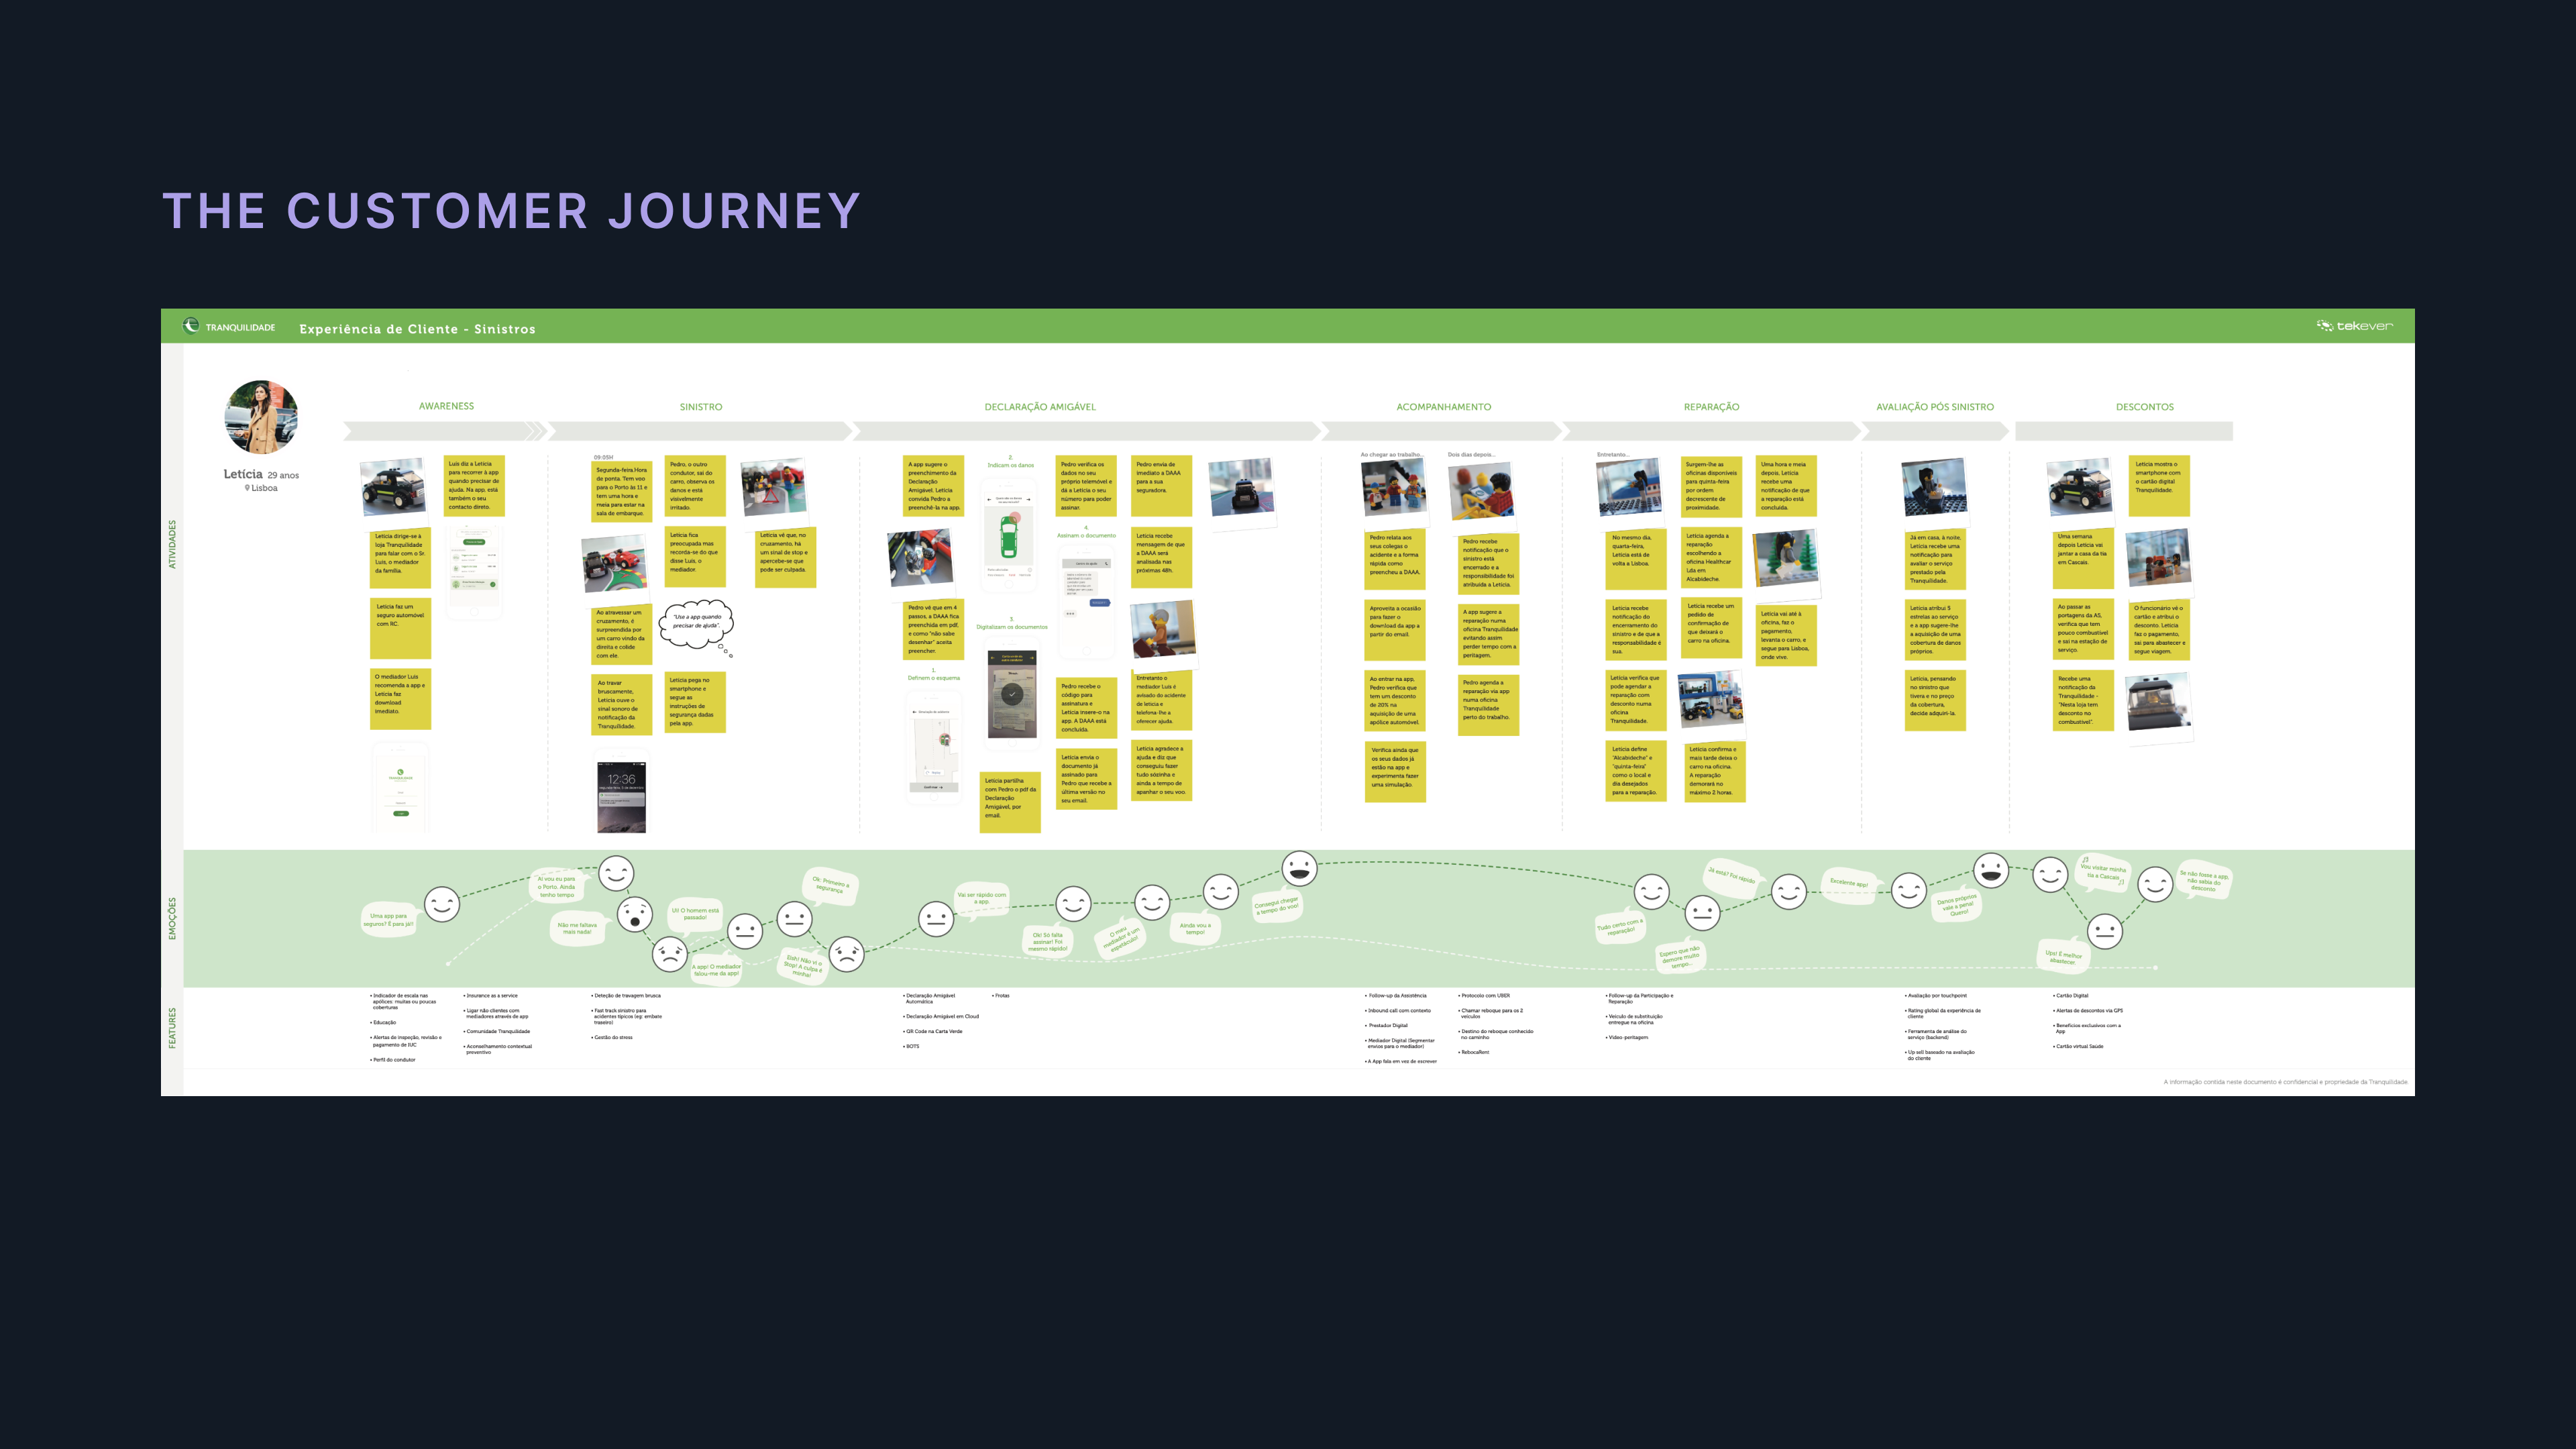
Field research and competitor analysis helped us visualize the whole experience of a car accident from the perspective of the customer.
Field research
- 4 insurance agents
- 4 customers with recent car accidents
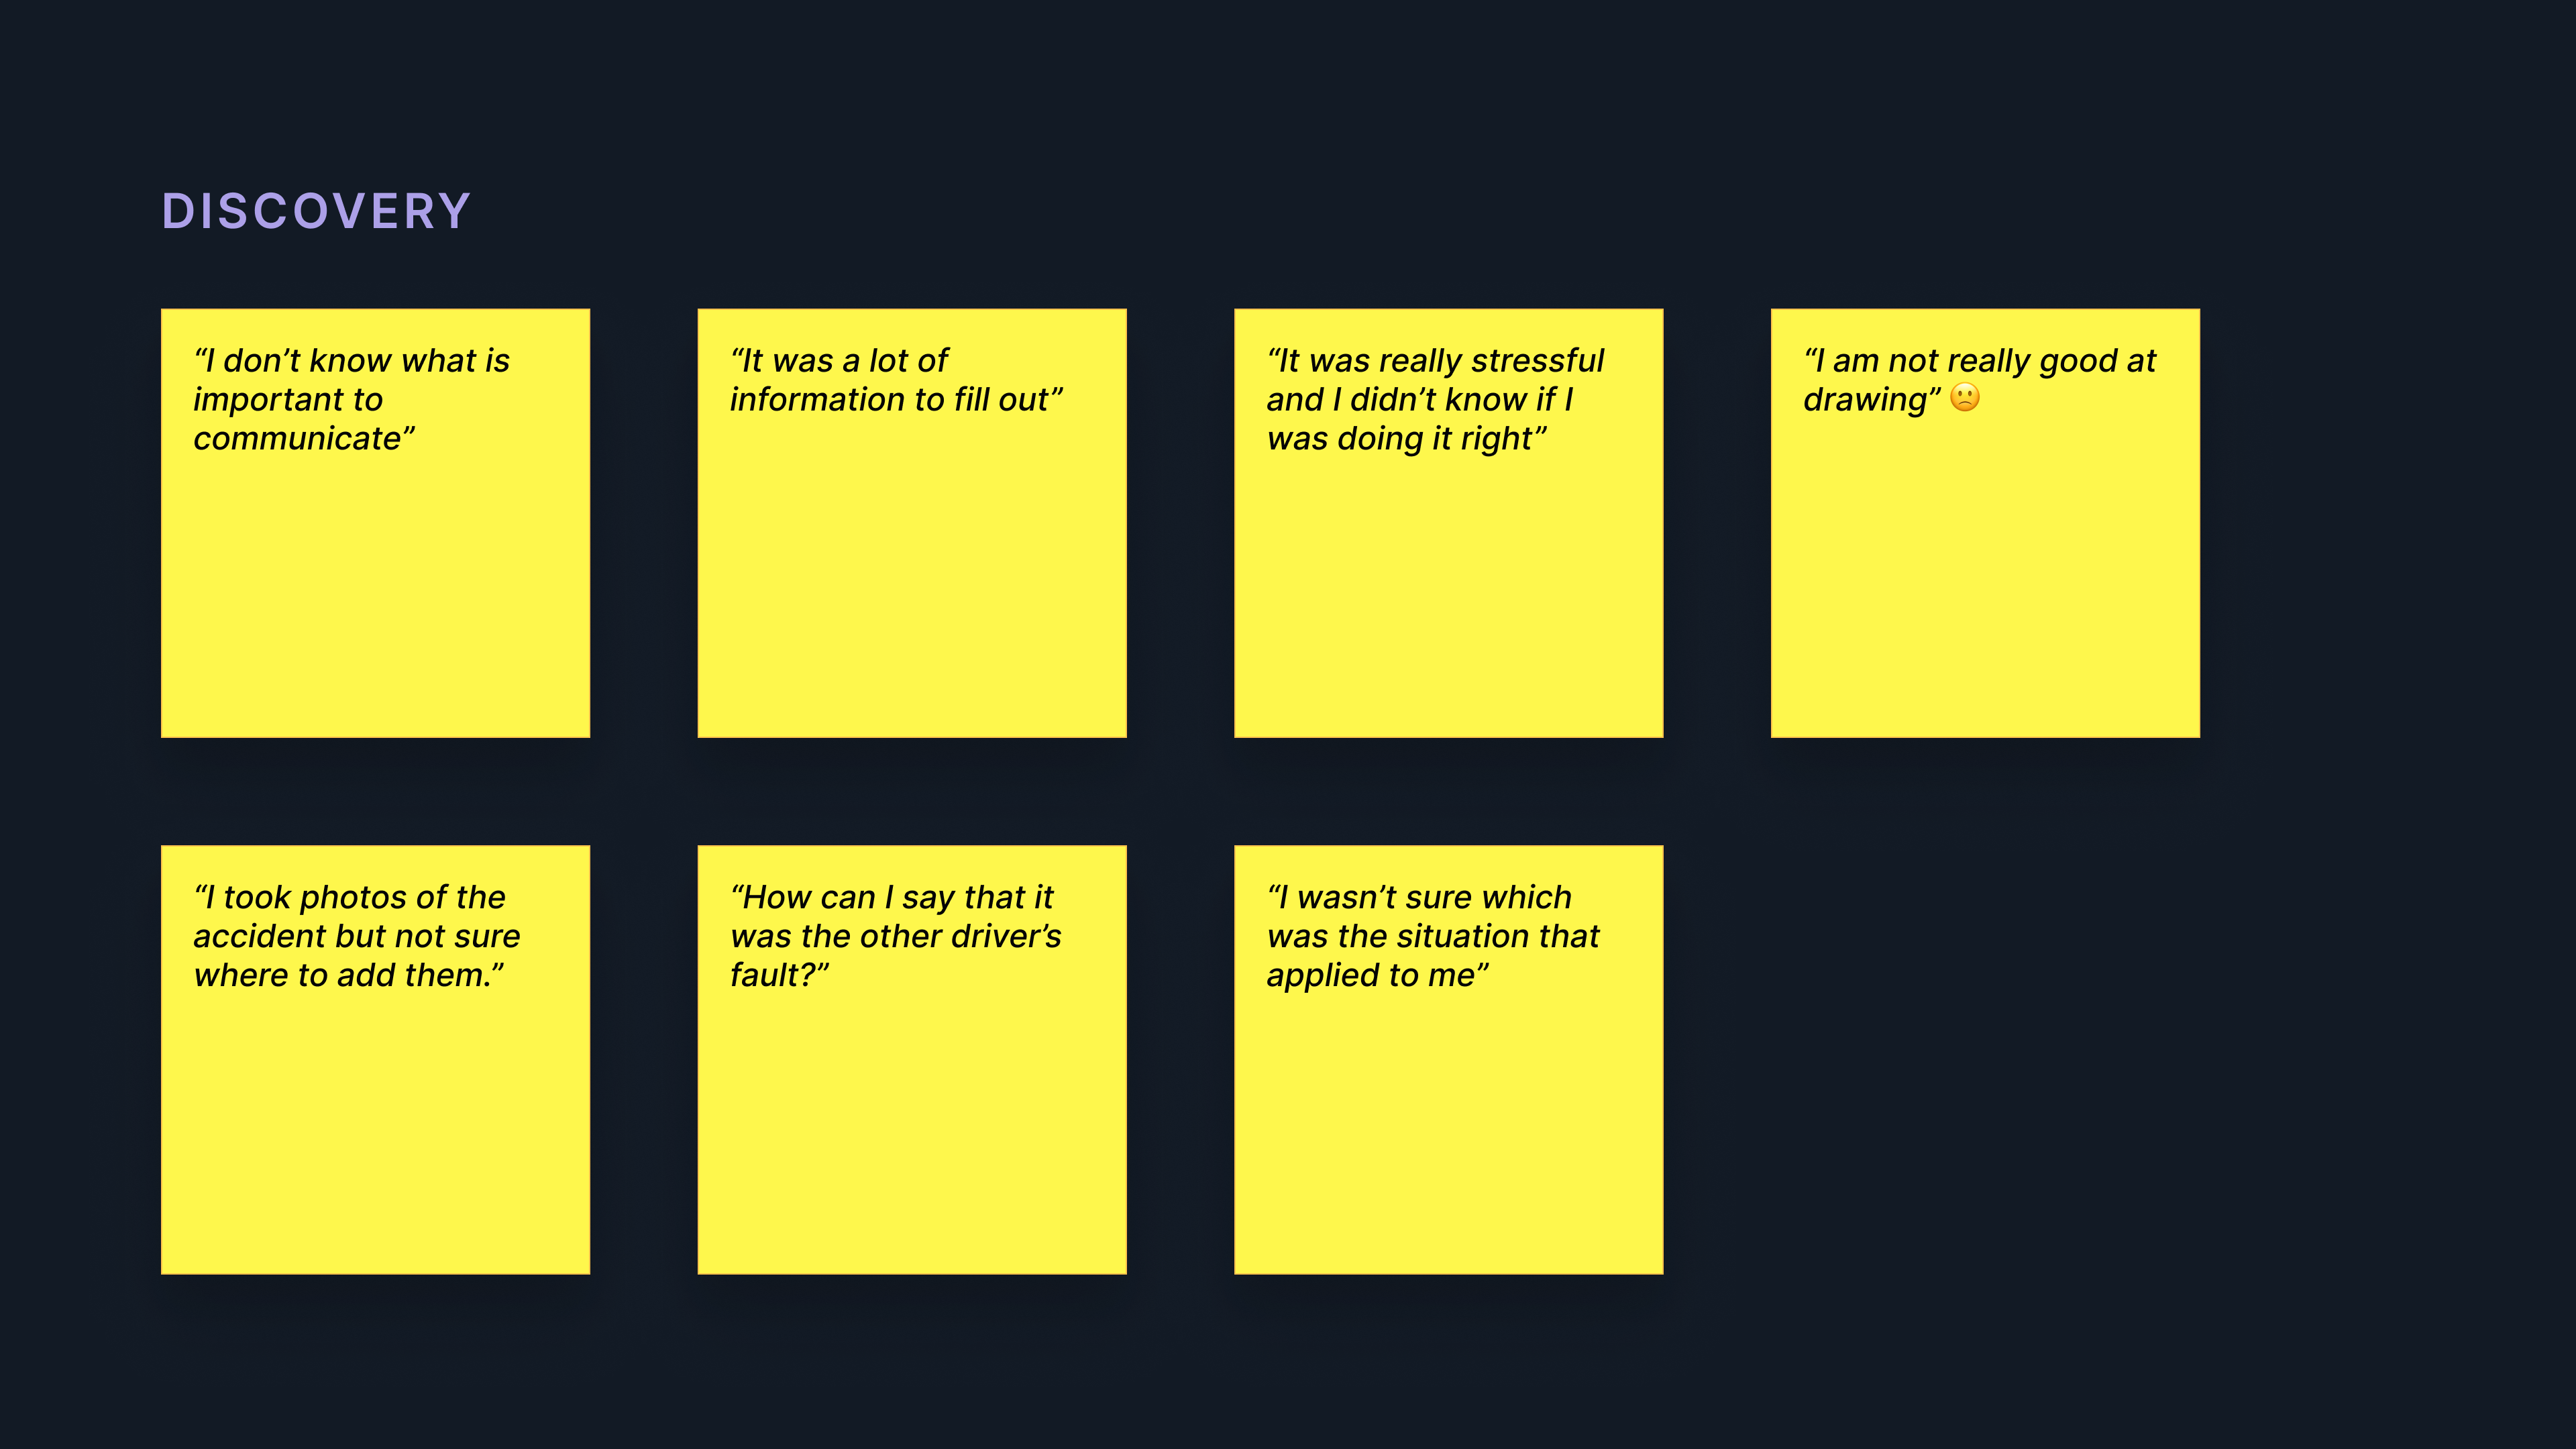
We also discovered patterns in customer problems that led us to identify which areas of the process we should focus on.
Design iteration 1
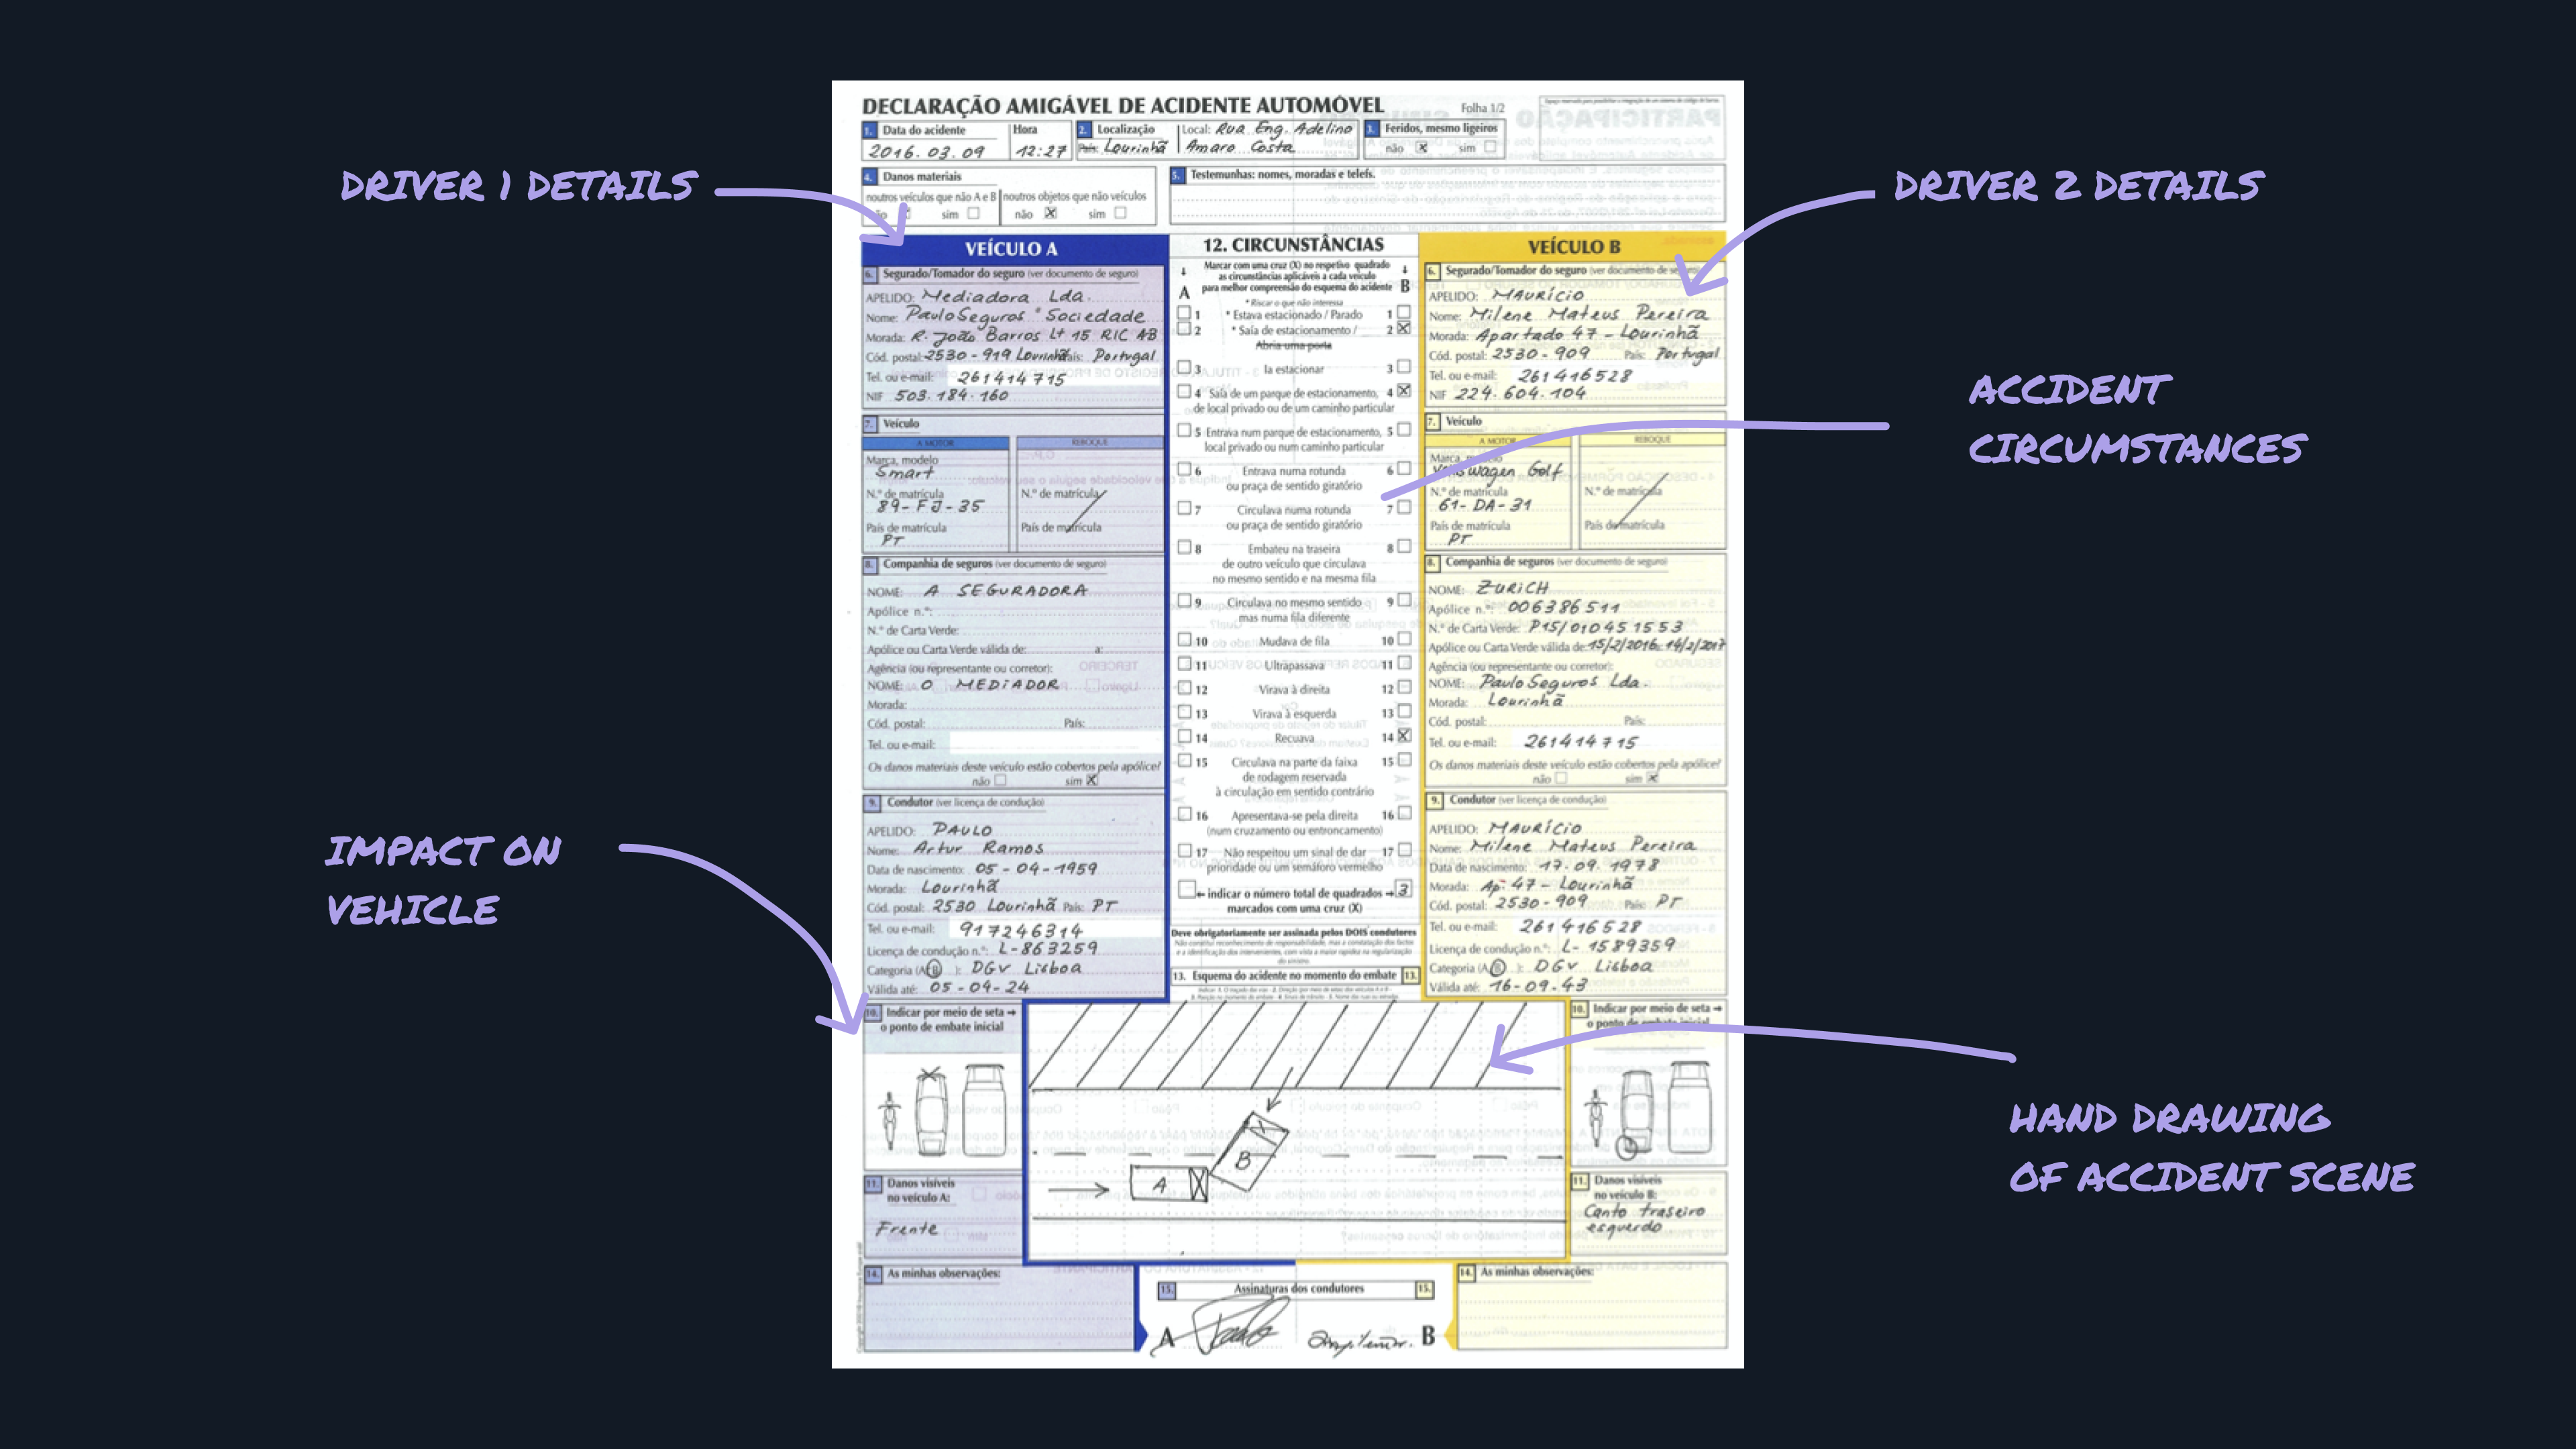
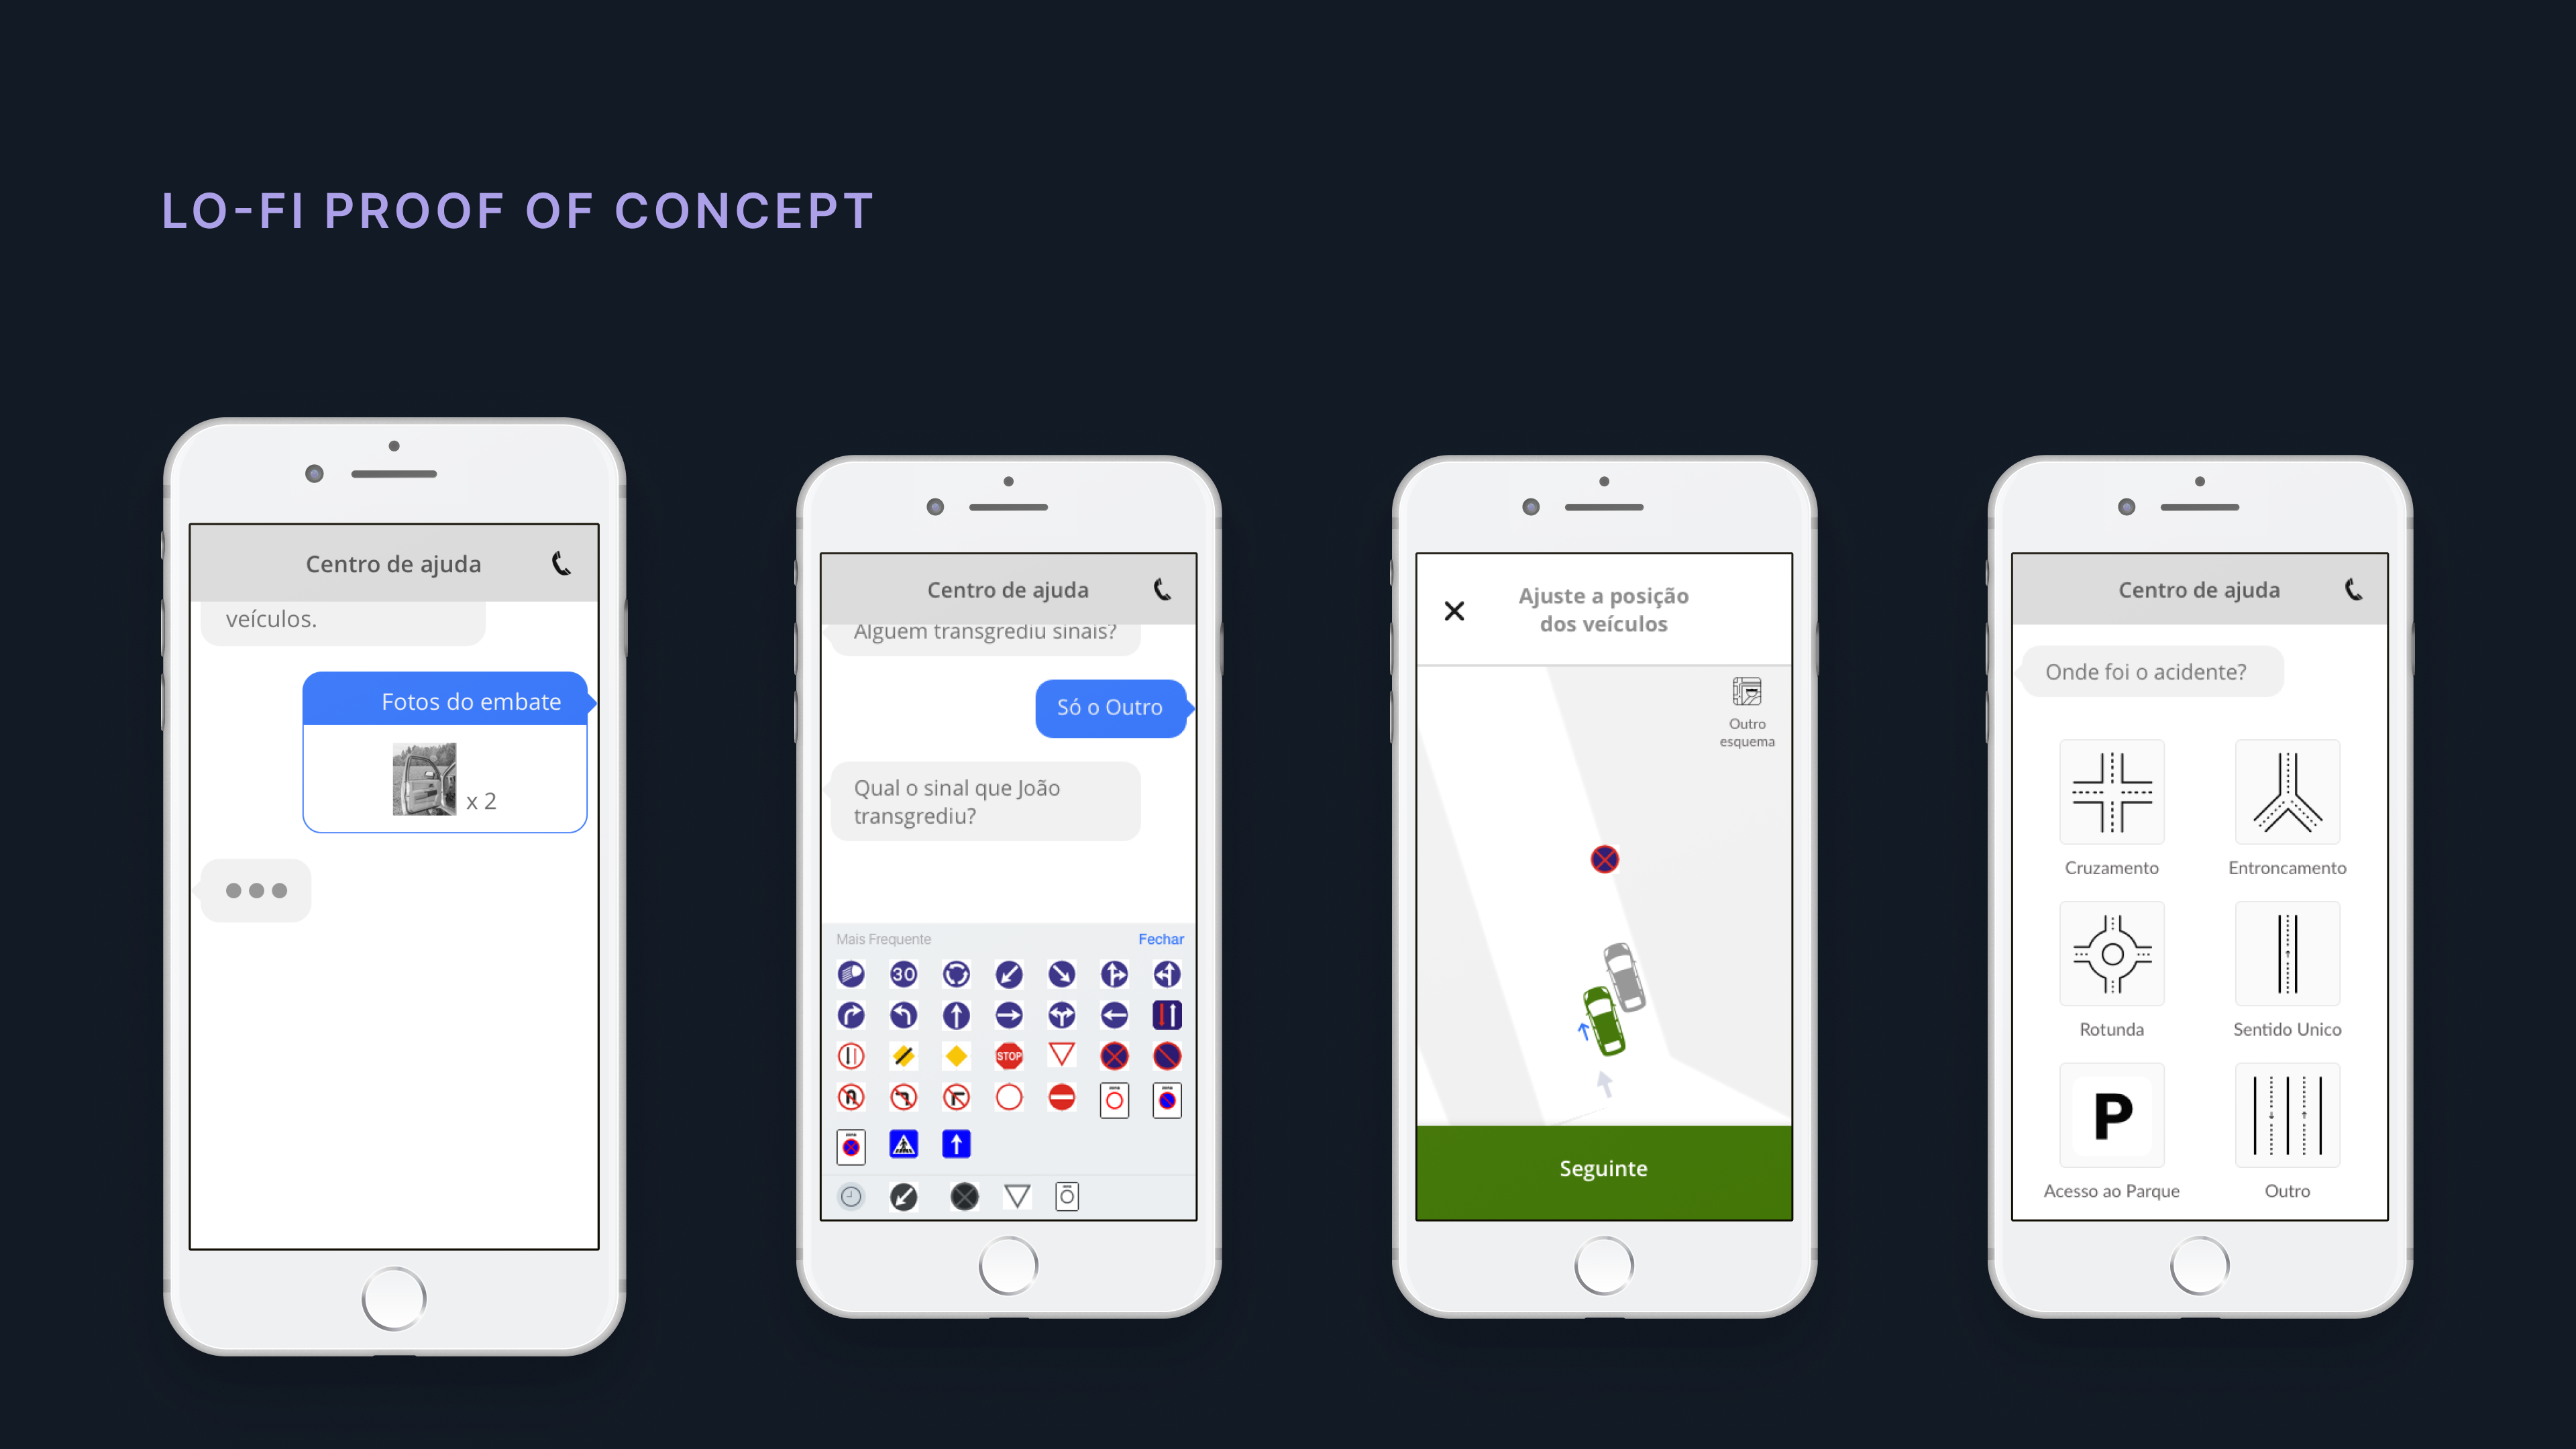
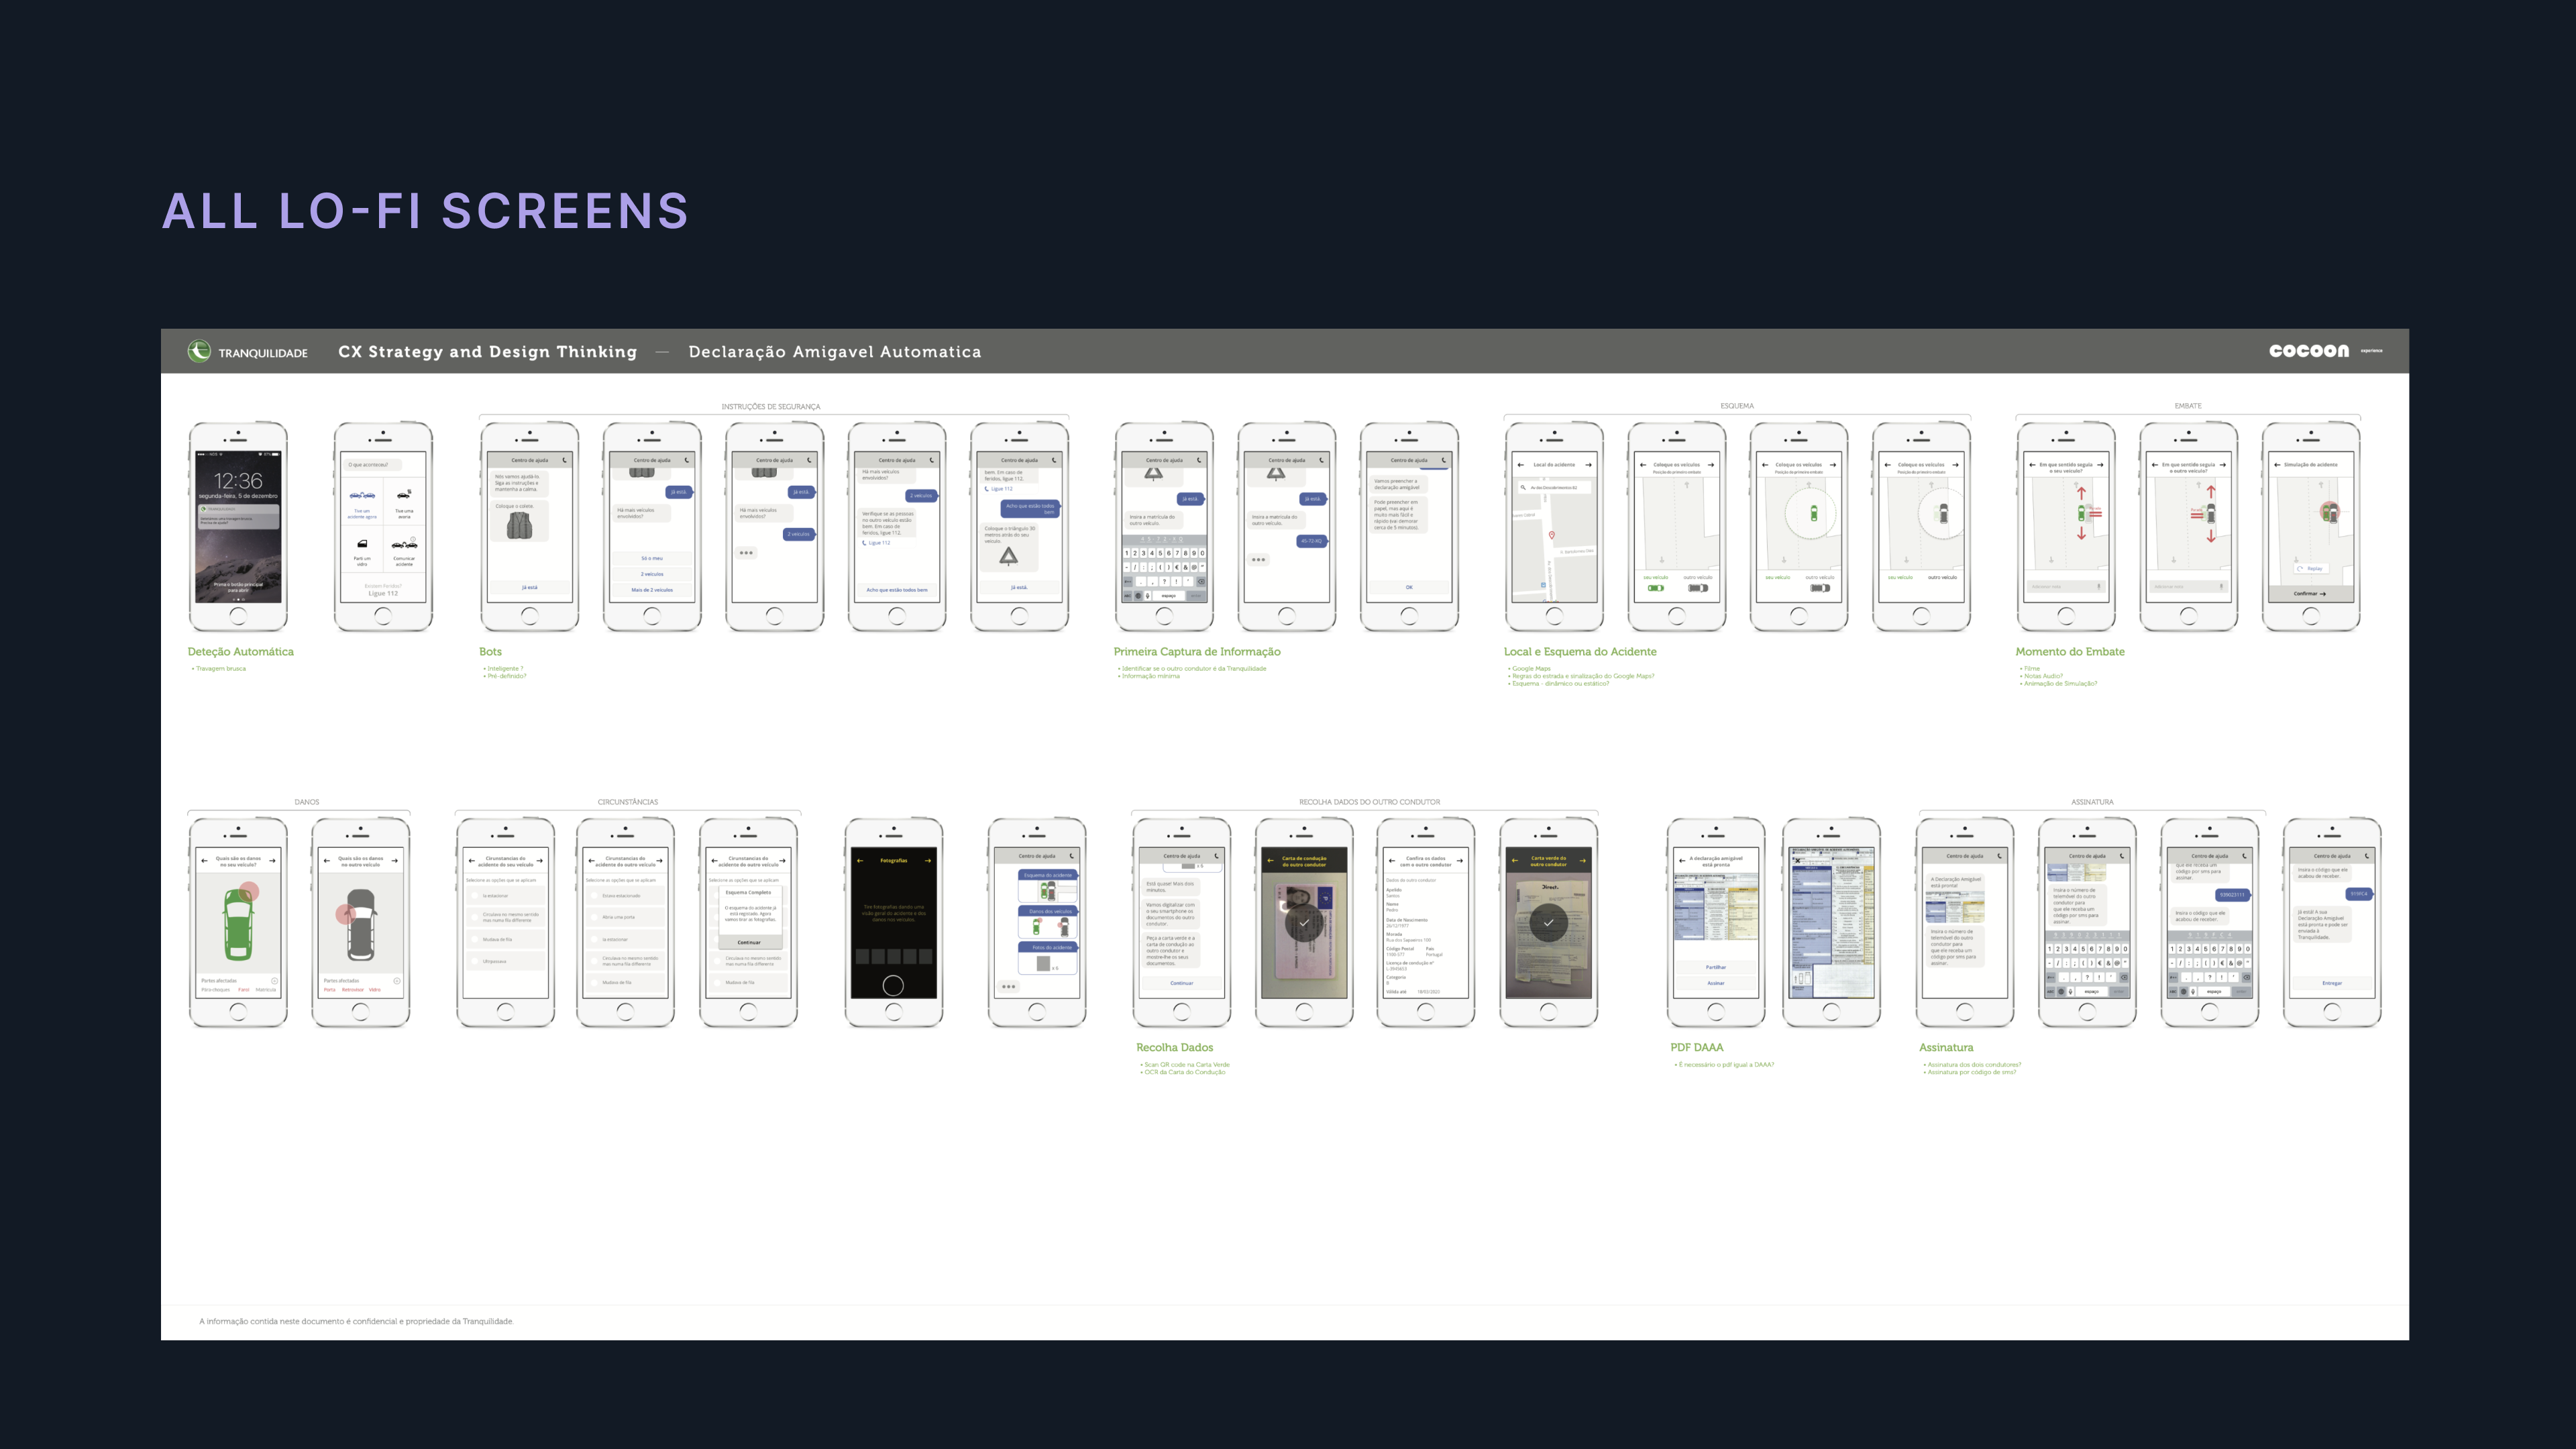
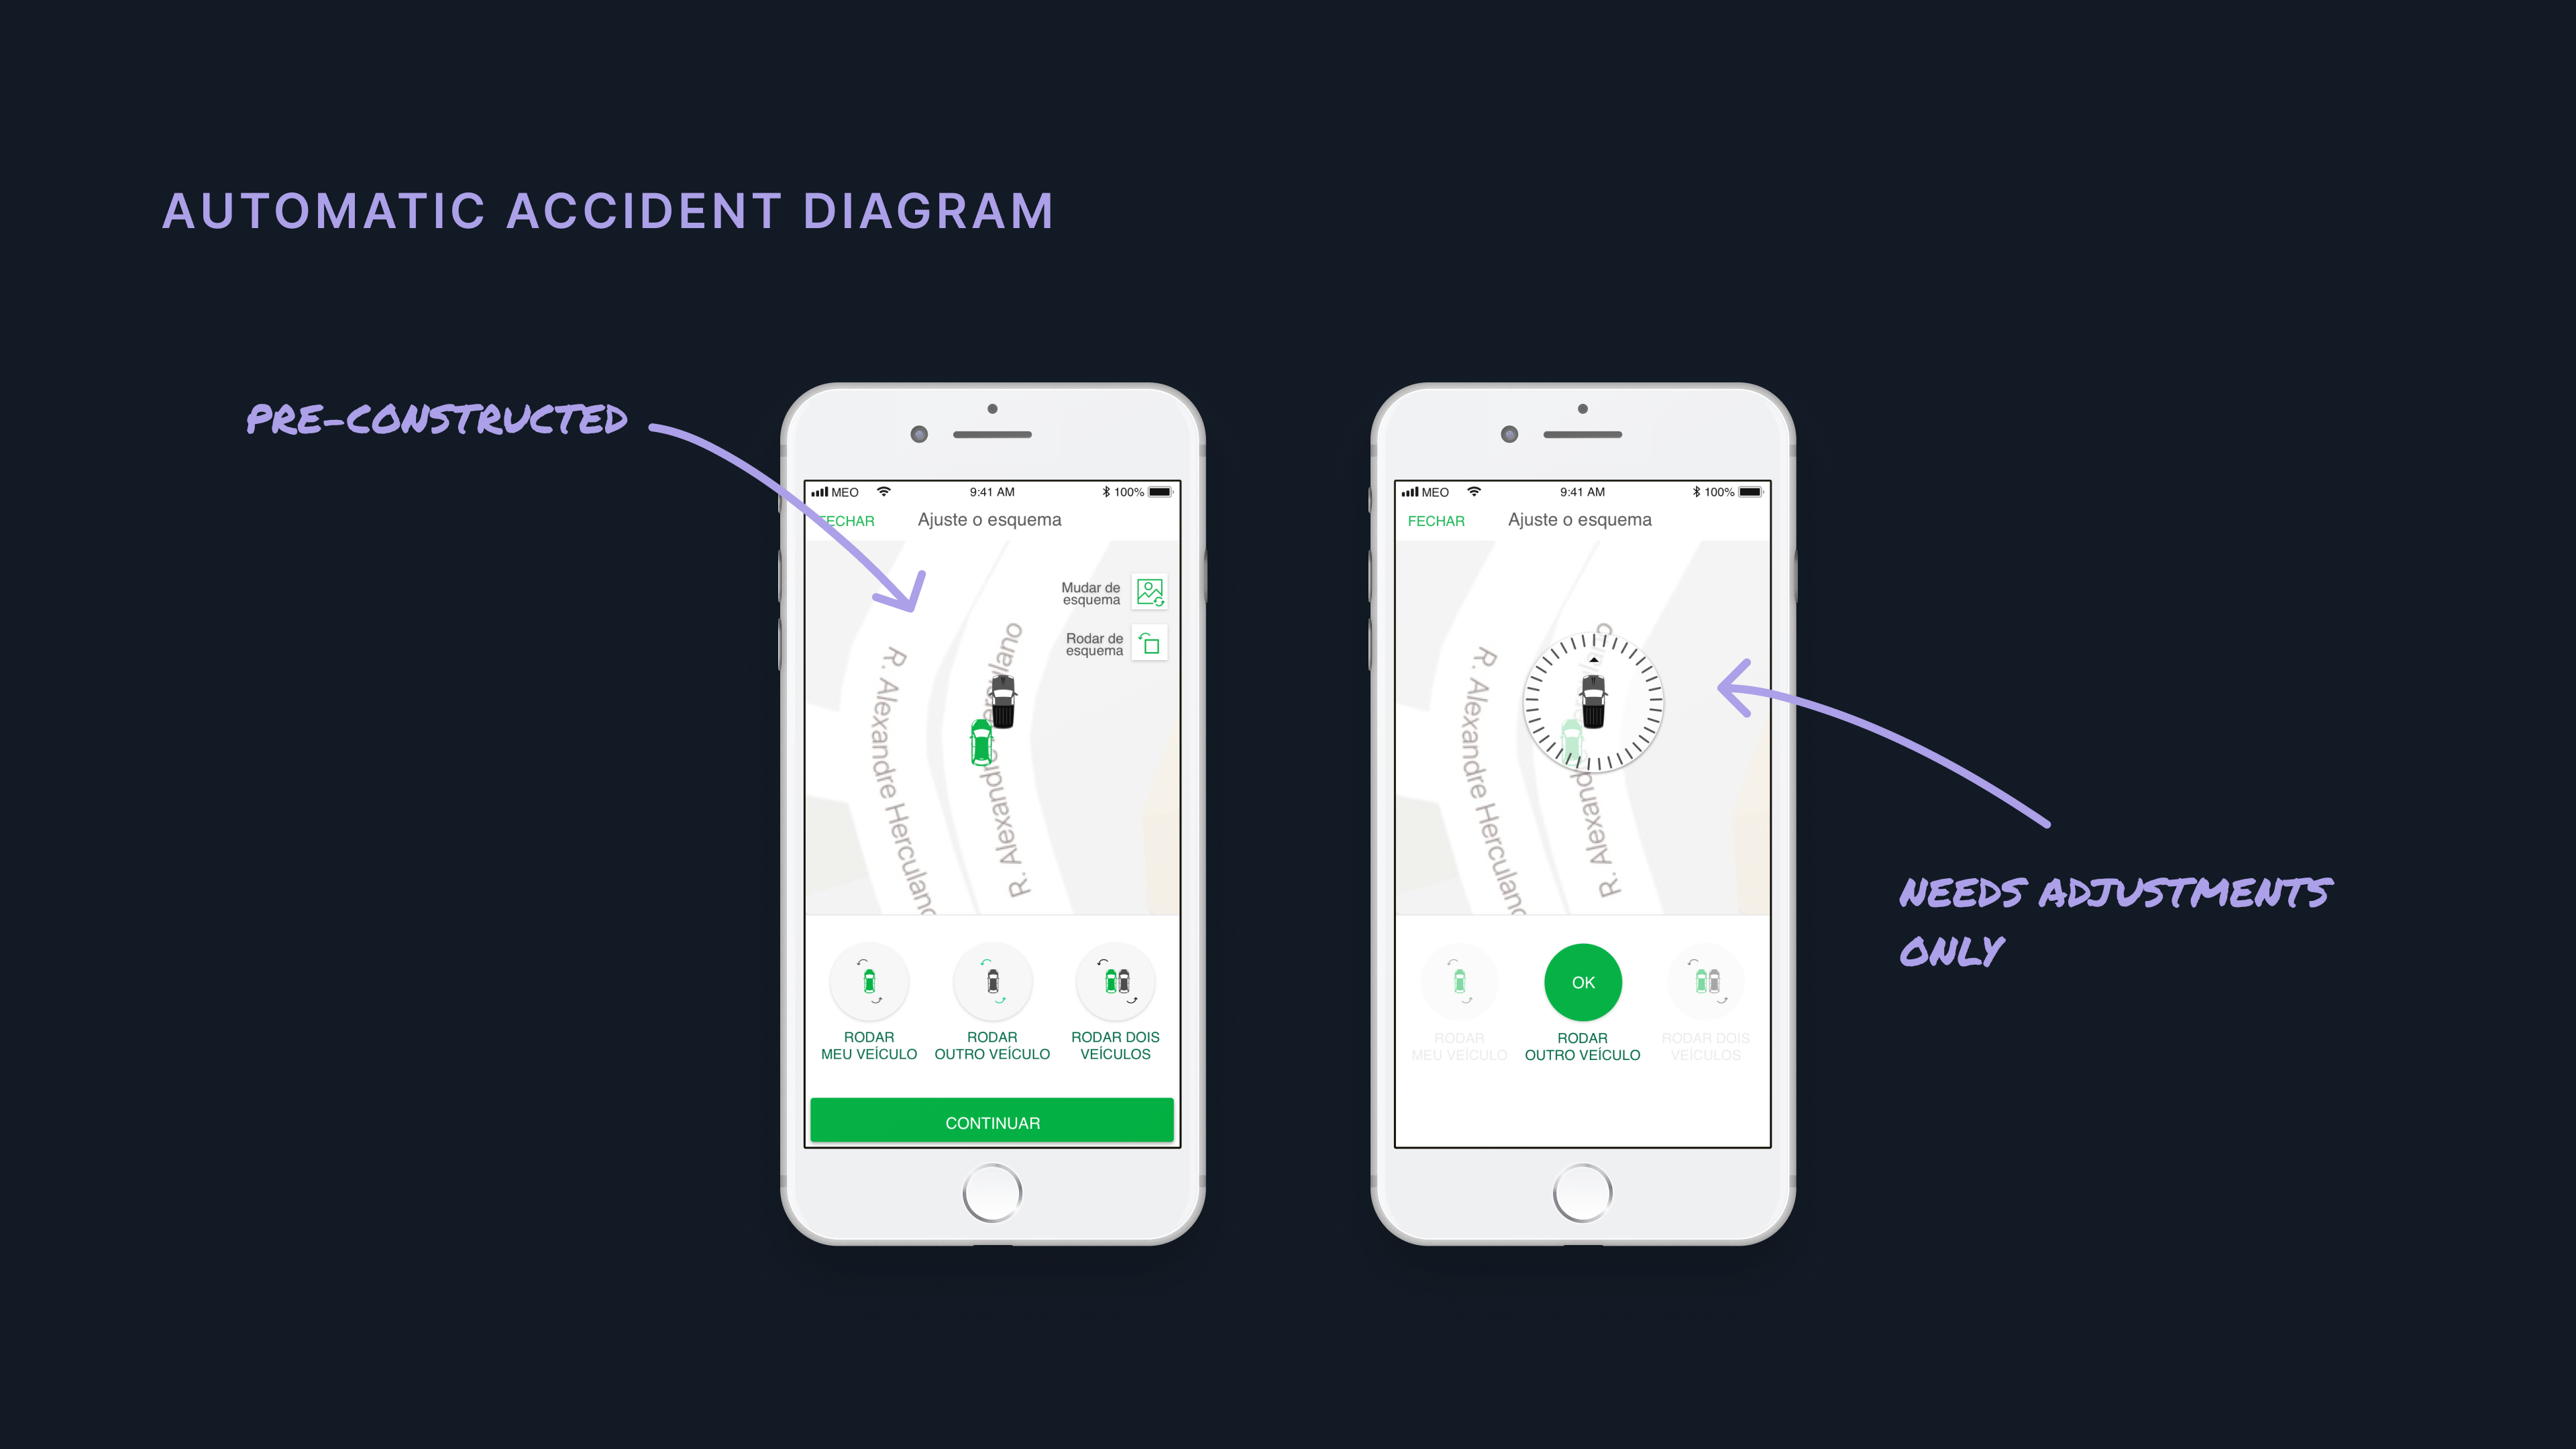
With the objective to guide the customer through the process to file a claim, we settled on a chatbot form factor pretty early in the exploration. By deconstructing the form, we identified which aspects of the form could be automated.
Design iteration 2
On testing the above prototypes using think-alouds with 4 participants, we were able to validate the core hypothesis and collect feedback on the overall flow.
“It’s kinda long”
While the participants found the experience better than a form, they mentioned that the flow was quite long and that they got a bit lost. With close to 50 questions, it was a long conversation that lasted between 20 and 30 minutes.
Collaborating with the business analyst, we discovered that there were many questions that we could combine or reduce, since we had the advantage ofThis actually saved the product experience conditional logic in our flow — something a paper form could not emulate.
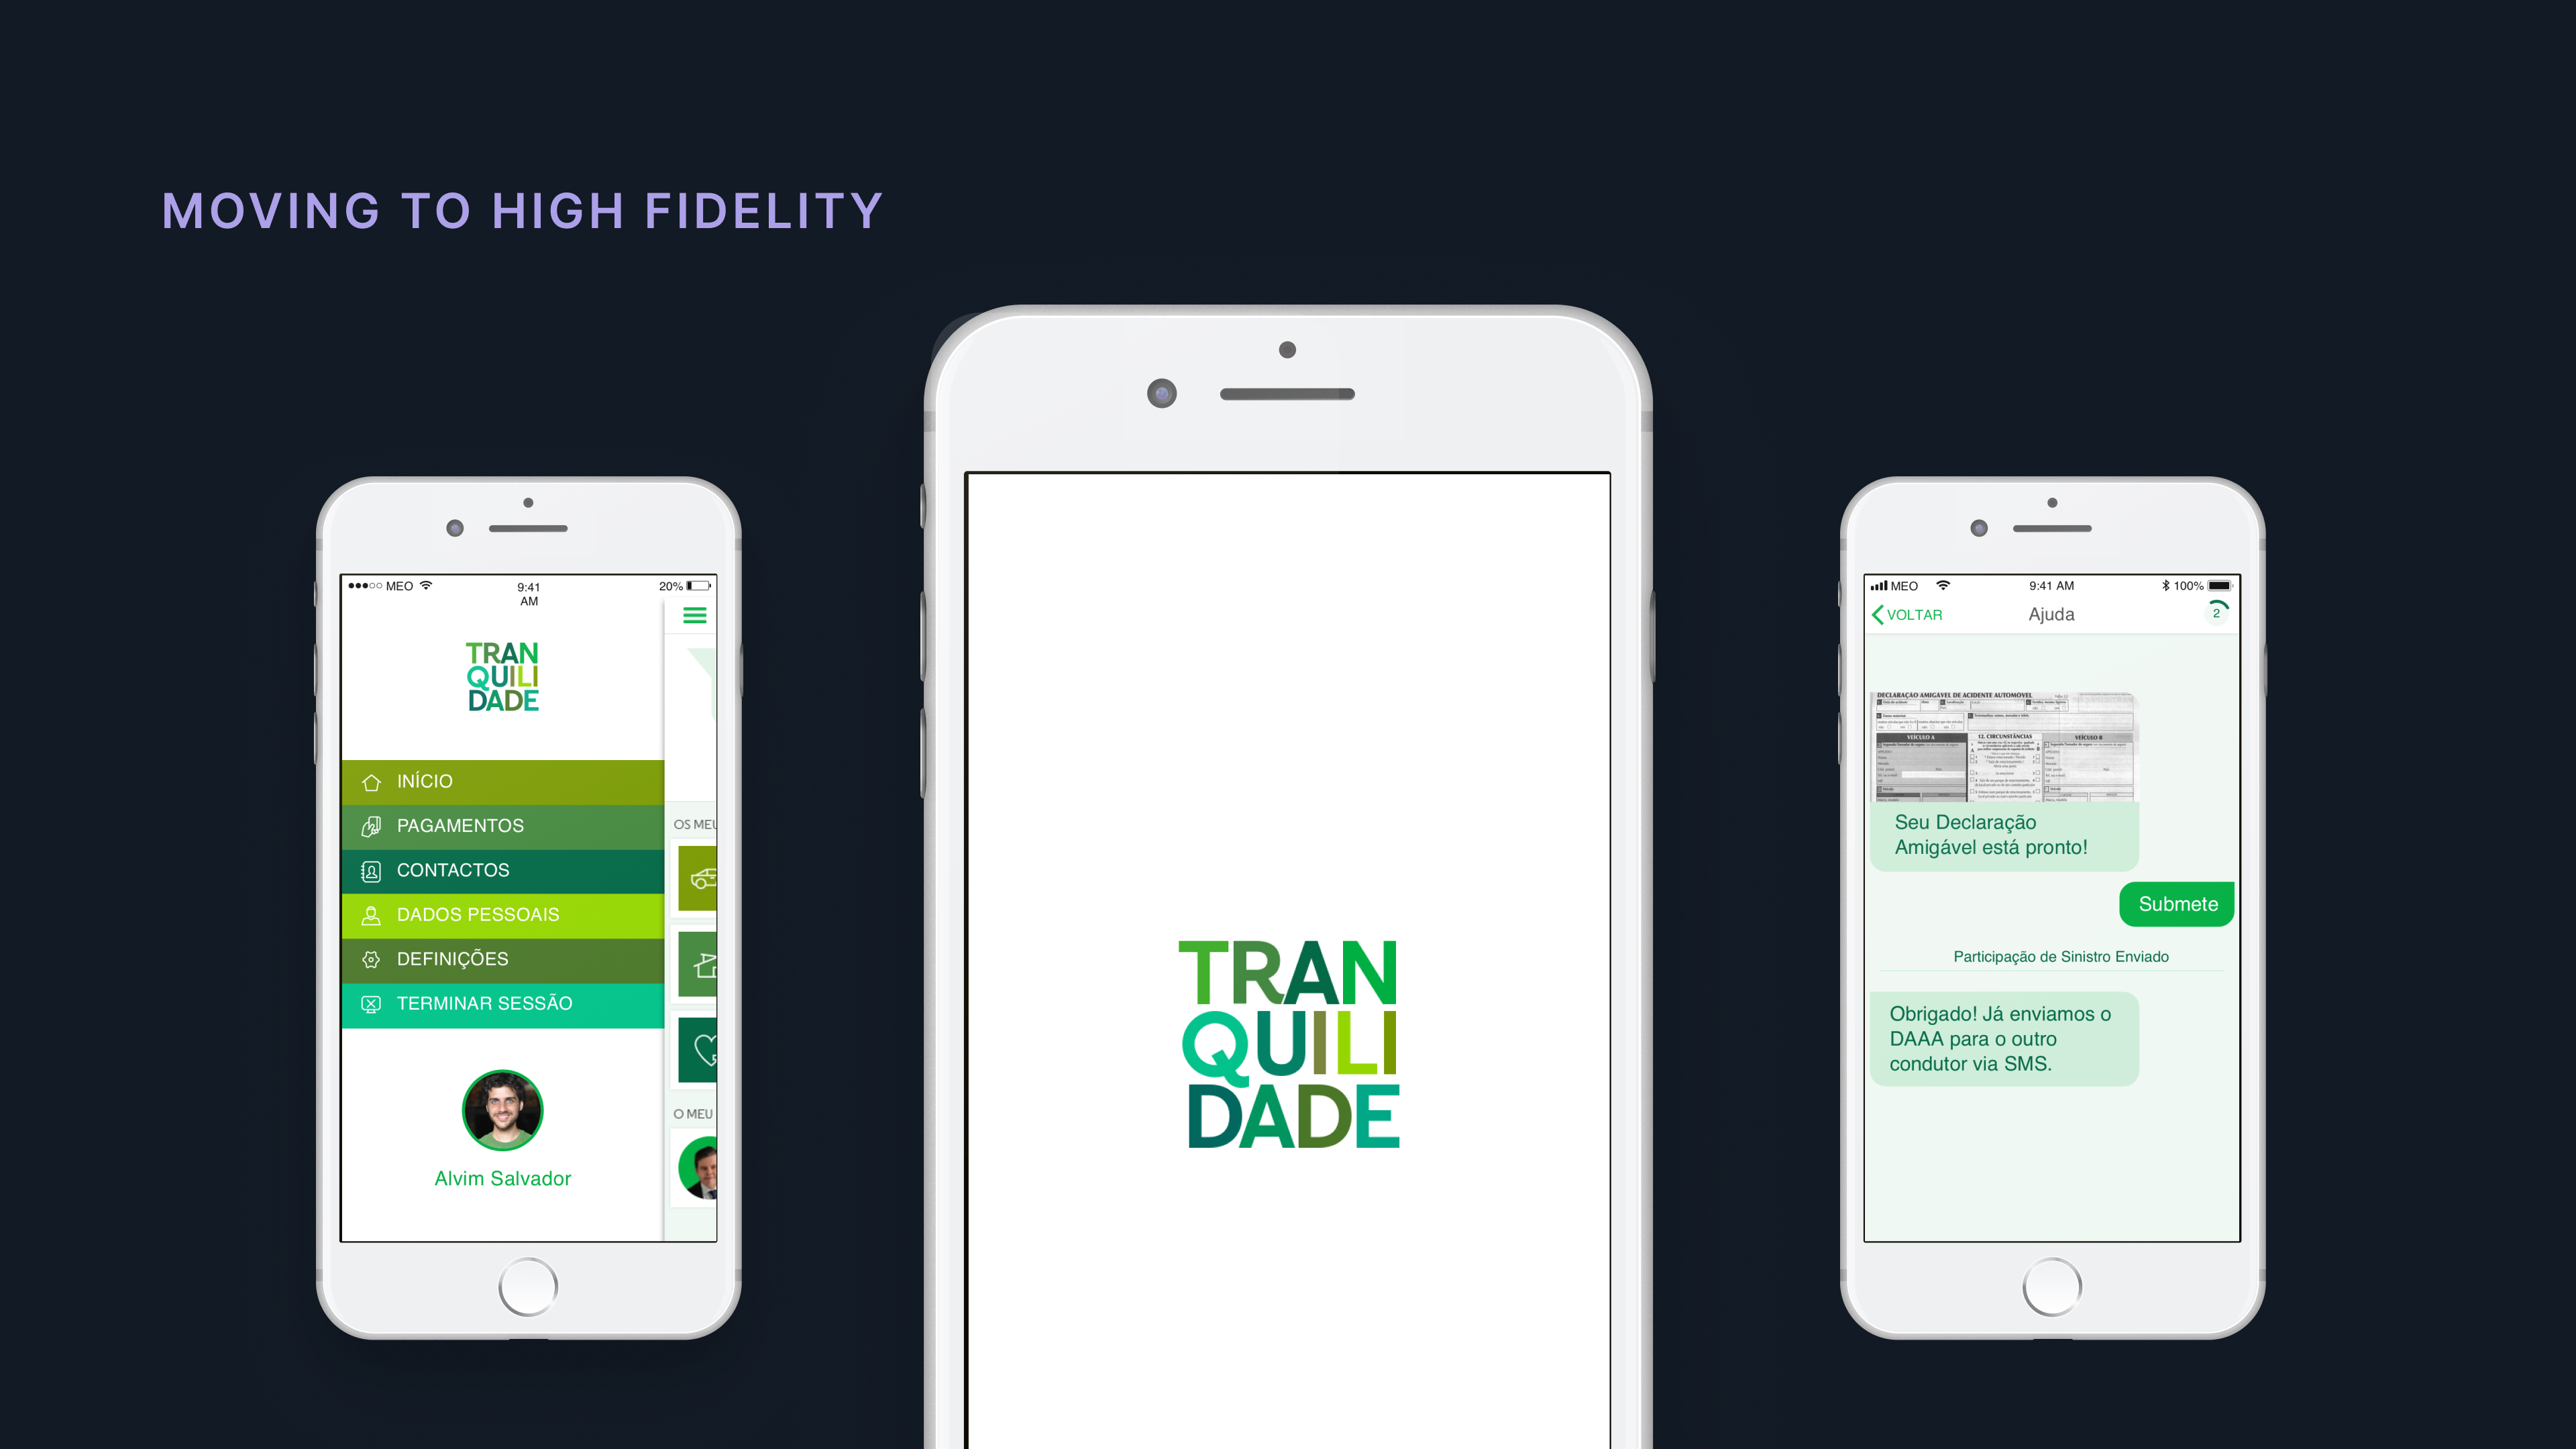
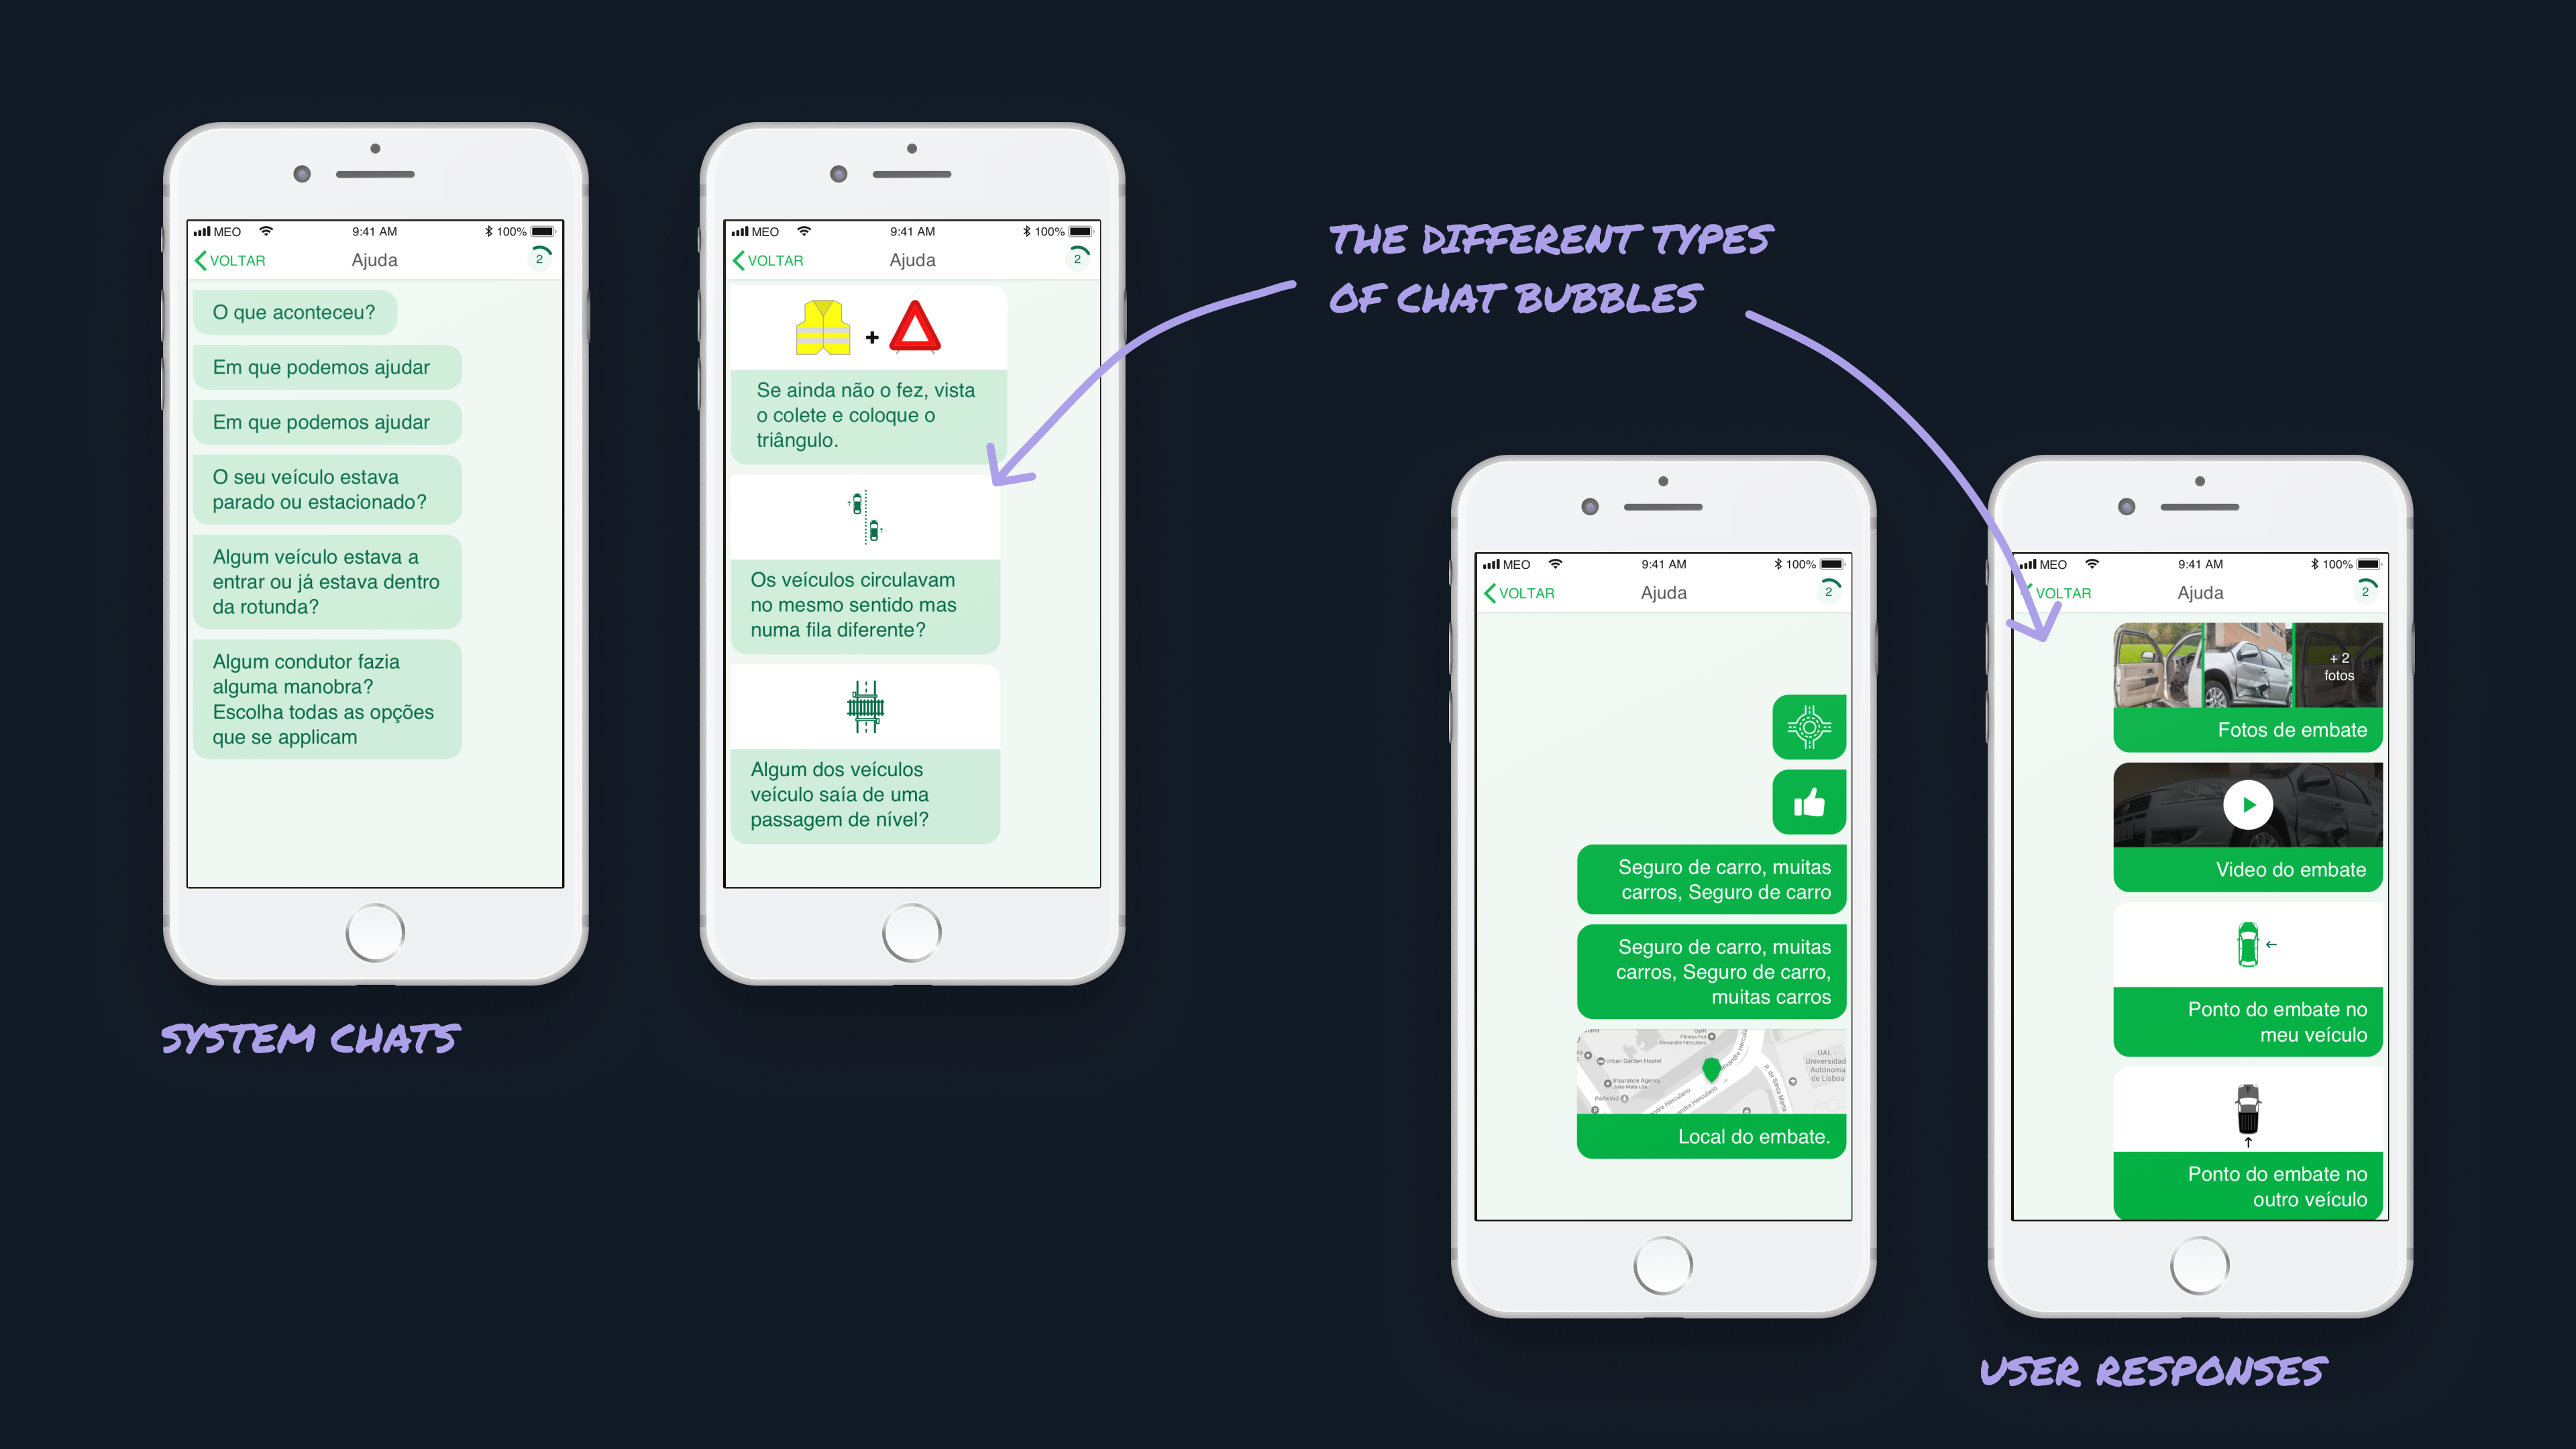
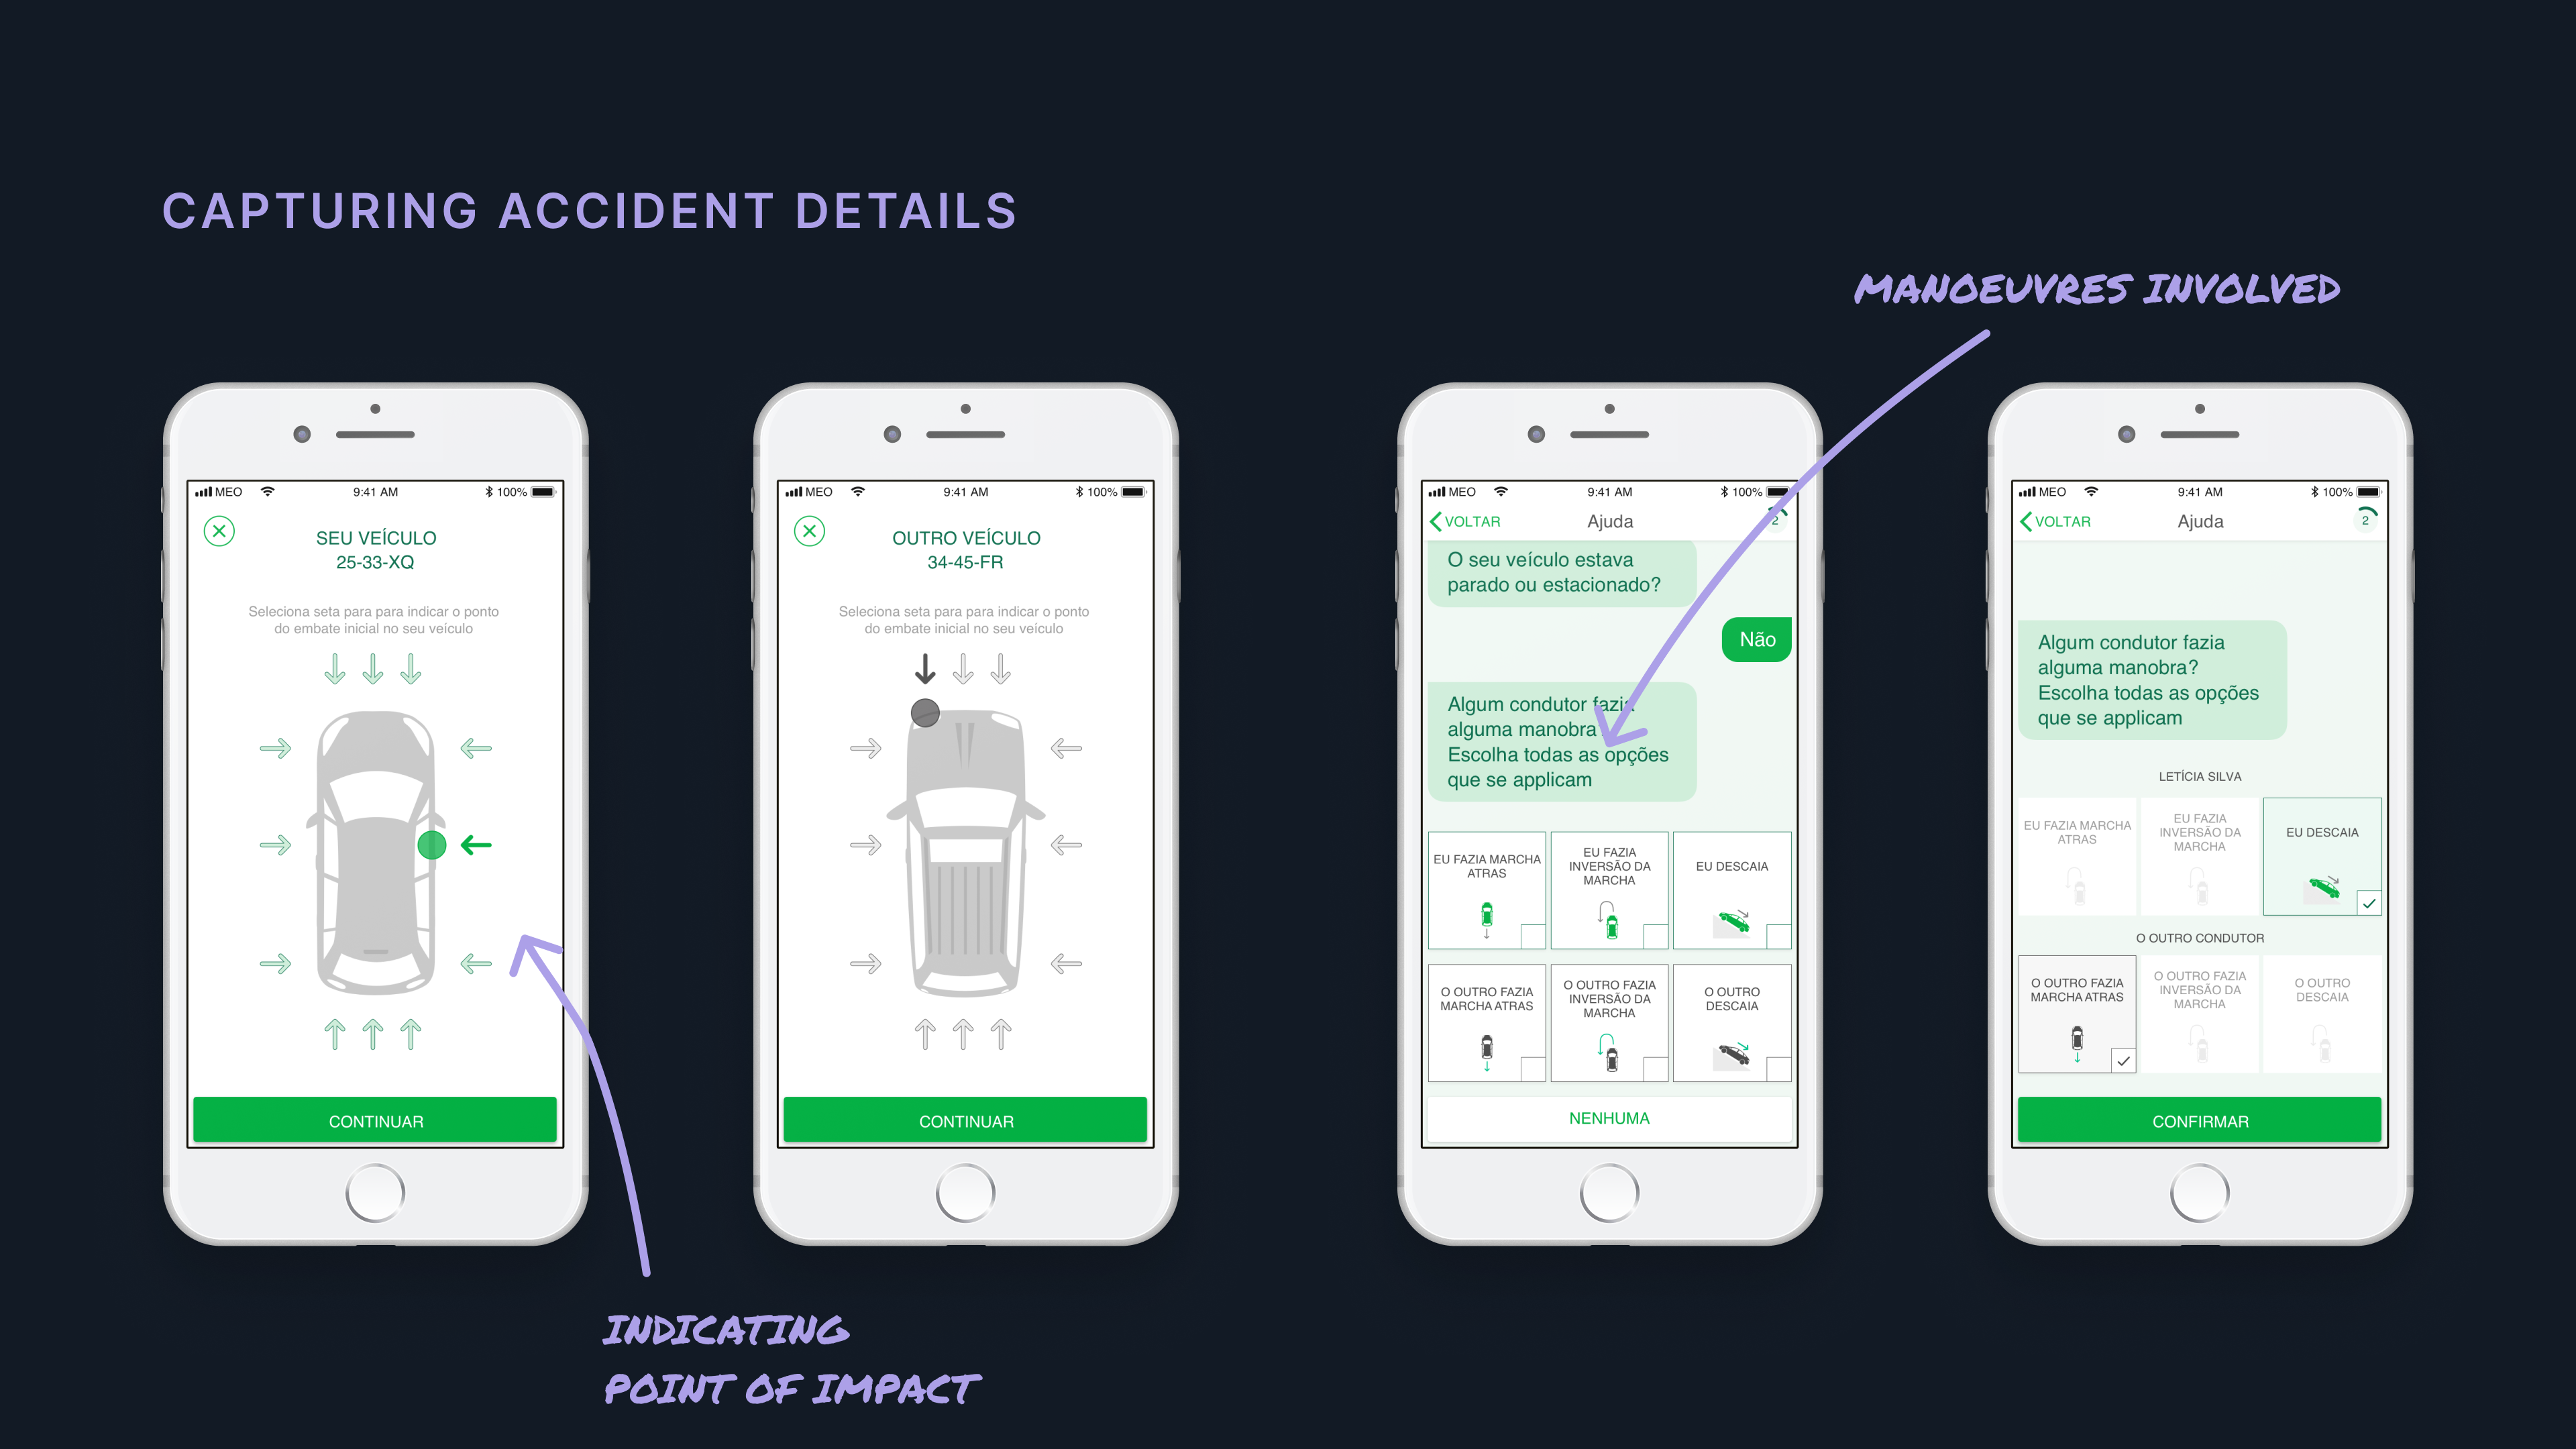
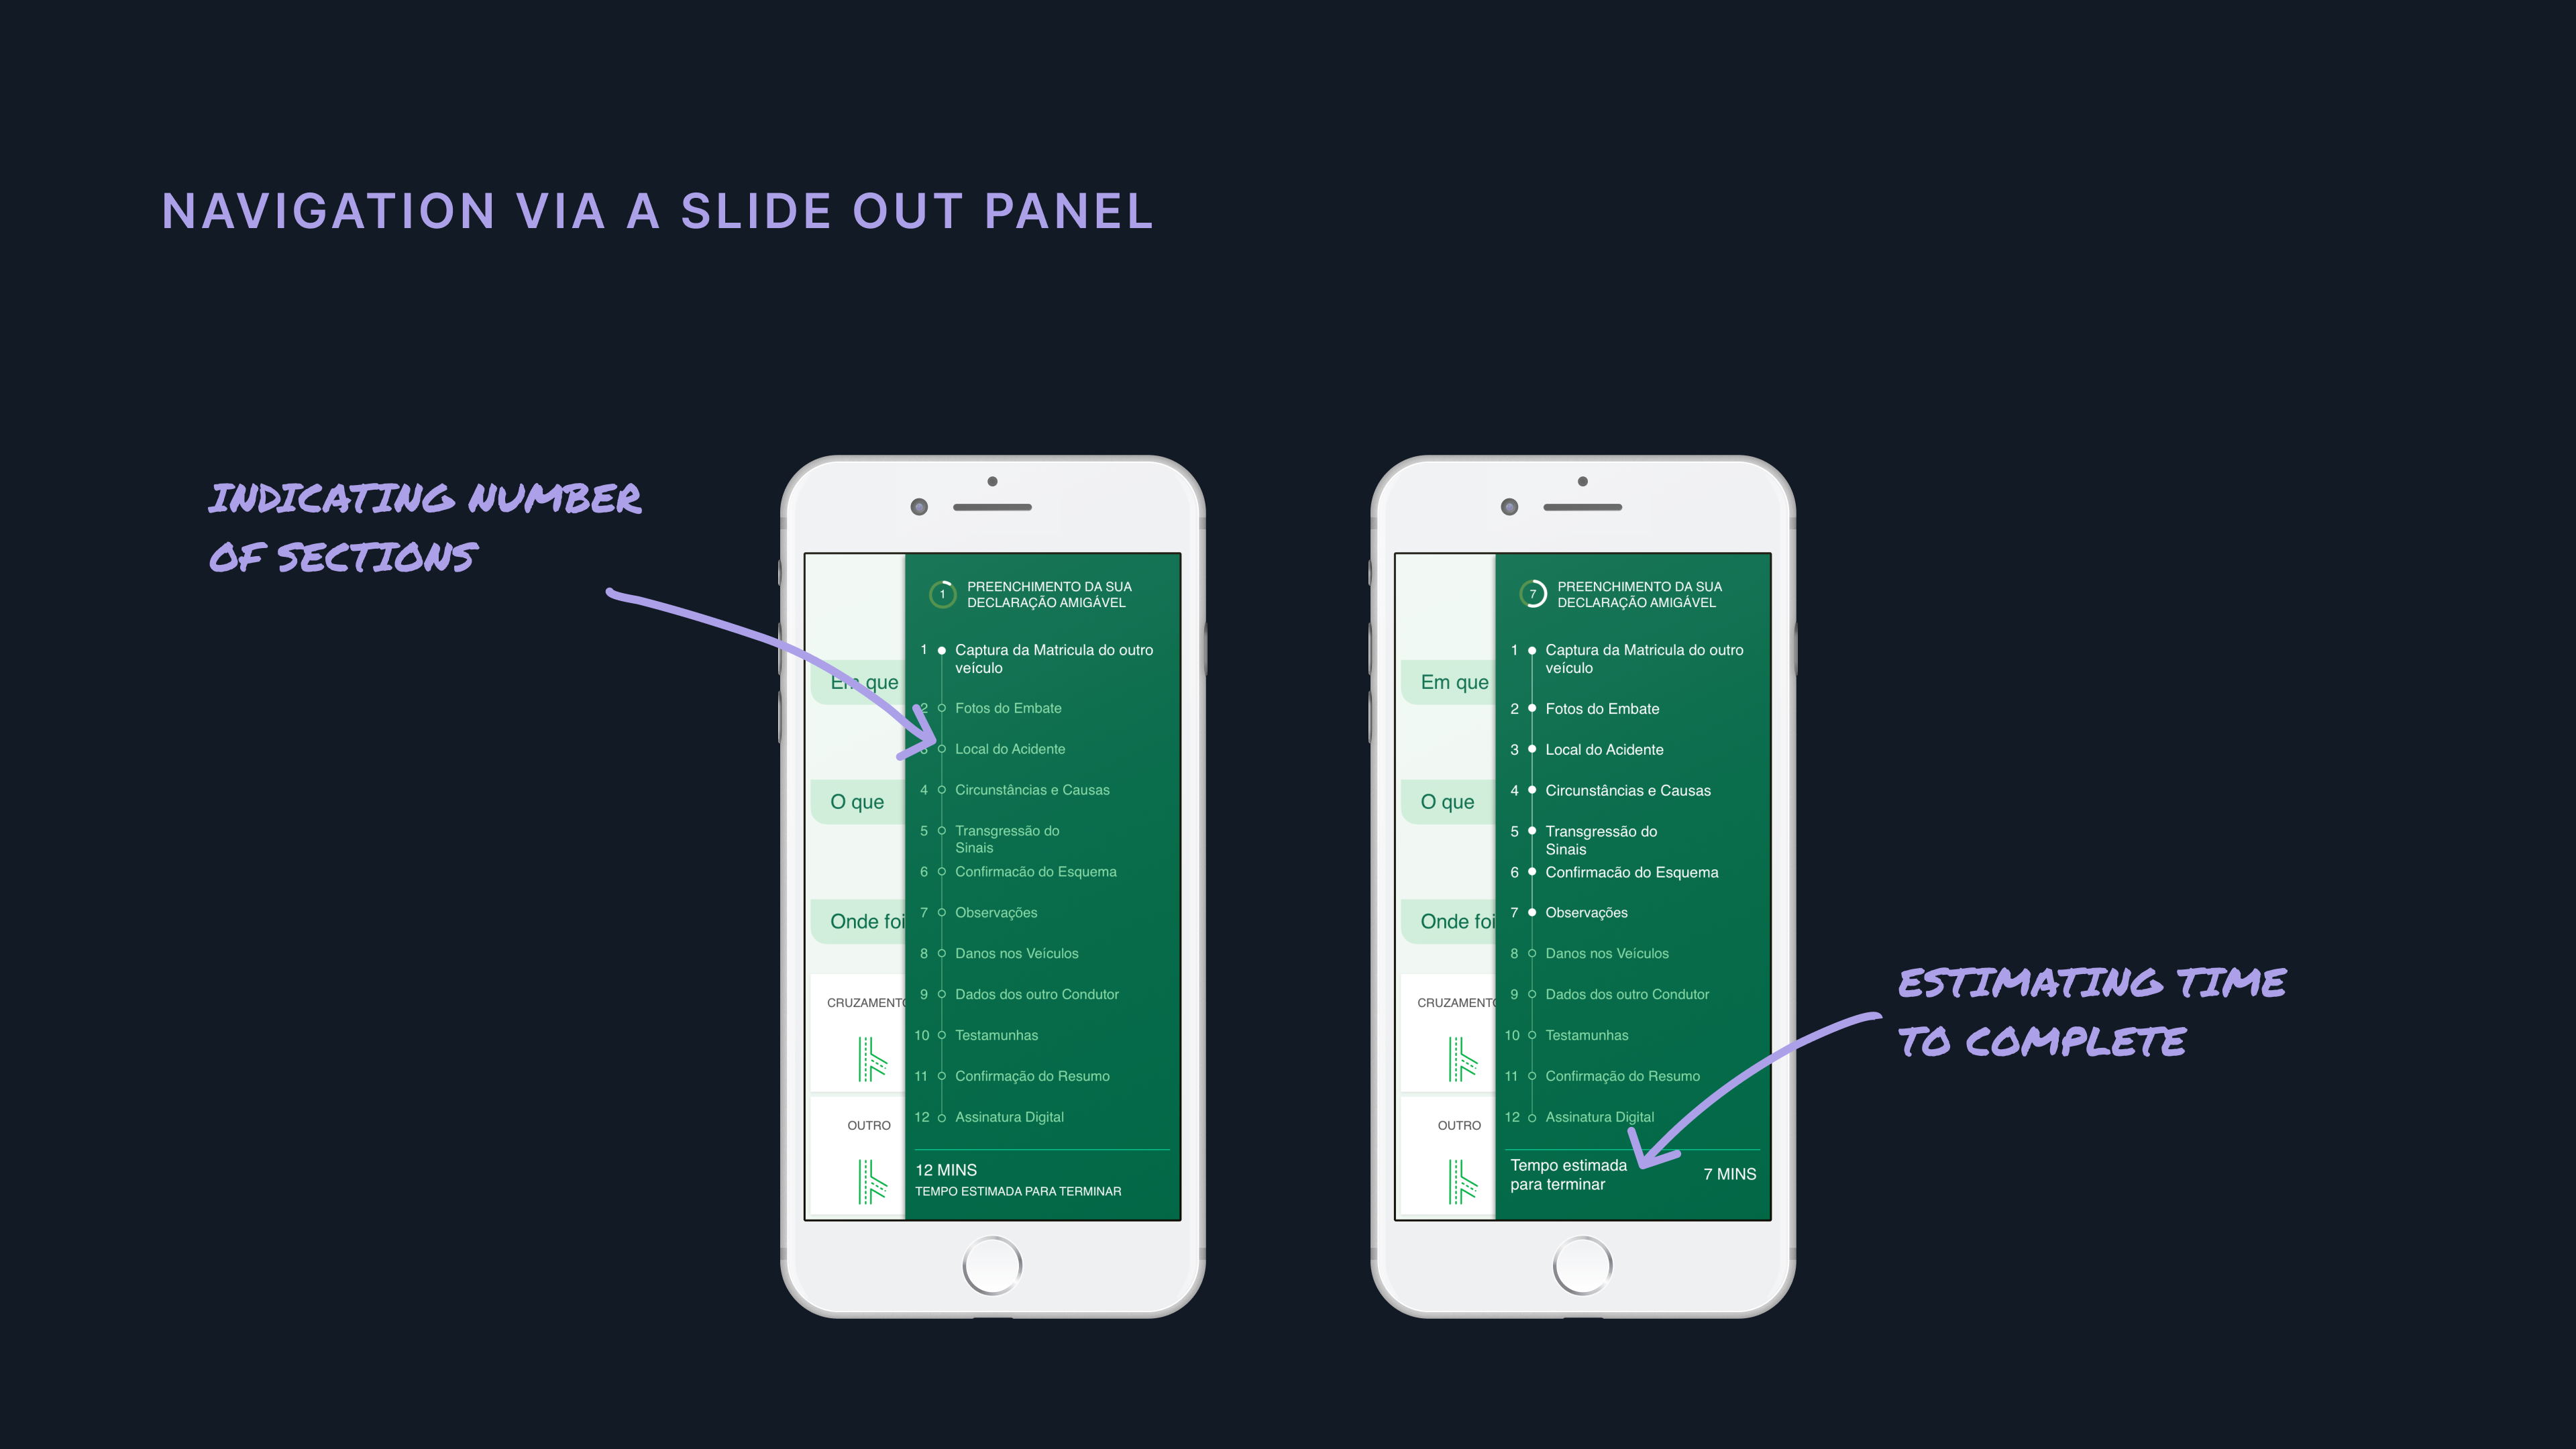
I added a navigation drawer for users to have a sense of progress and to facilitate moving between sections, instead of only scrolling.
Design iteration 3
Testing the above iteration led to completion in less than 15 minutes. Development kicked off with the reduced question set.
However, due to a healthy tensionA real disagreement on what good looks like between the business analyst and me on the approach, we returned to the data to identify whether there were any other optimisations we could introduce to further reduce the question set.
This insistence on iterative improvement led us to a game-changing discovery. A staggering 27% of all accident claims in the previous year belonged to a single typology of accident. Cumulatively, 57% of all accident claims in the previous year belonged to just four accident types.
This made sense. Most accidents are simple fender benders or a case of road priority not being respected.
27%
of claims were a single accident typology
57%
came from just four accident types
90%+
inferred with up to two questions
Using a similar approach, we found more patterns in the data when we grouped by accident typology. We then sorted these groups by frequency of occurrence to arrive at three distinct ‘fast-lanes’.
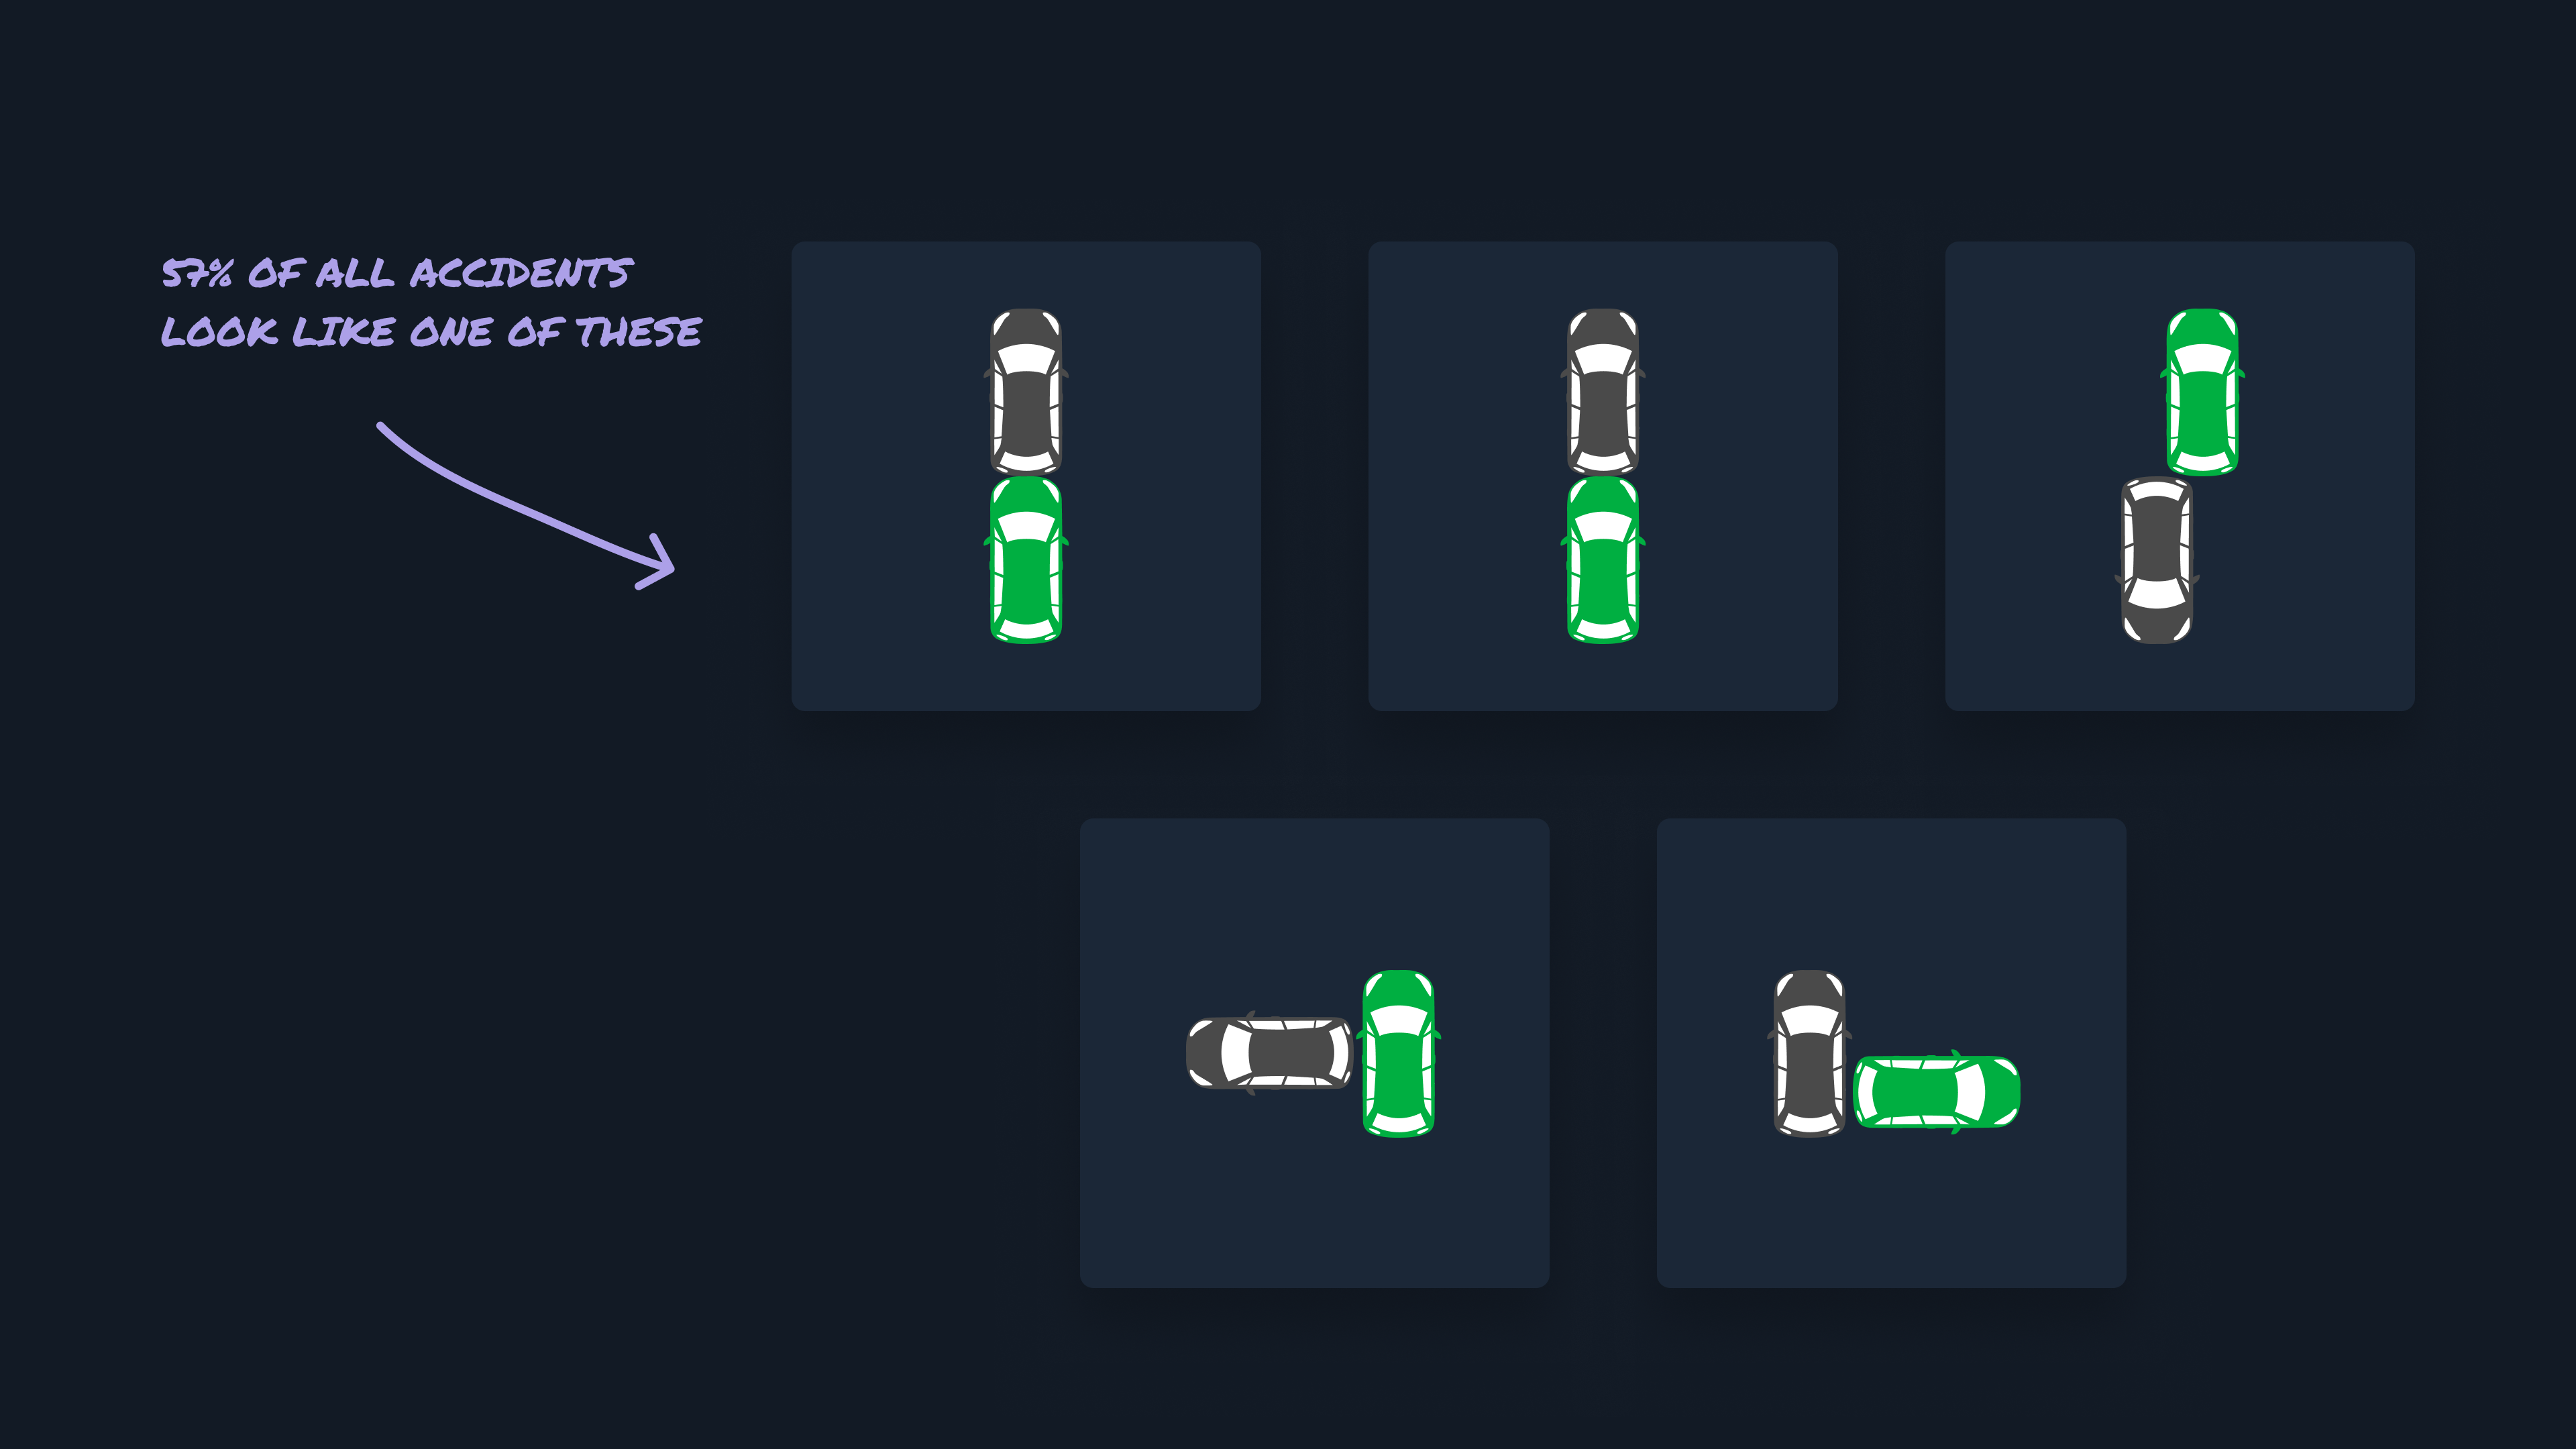
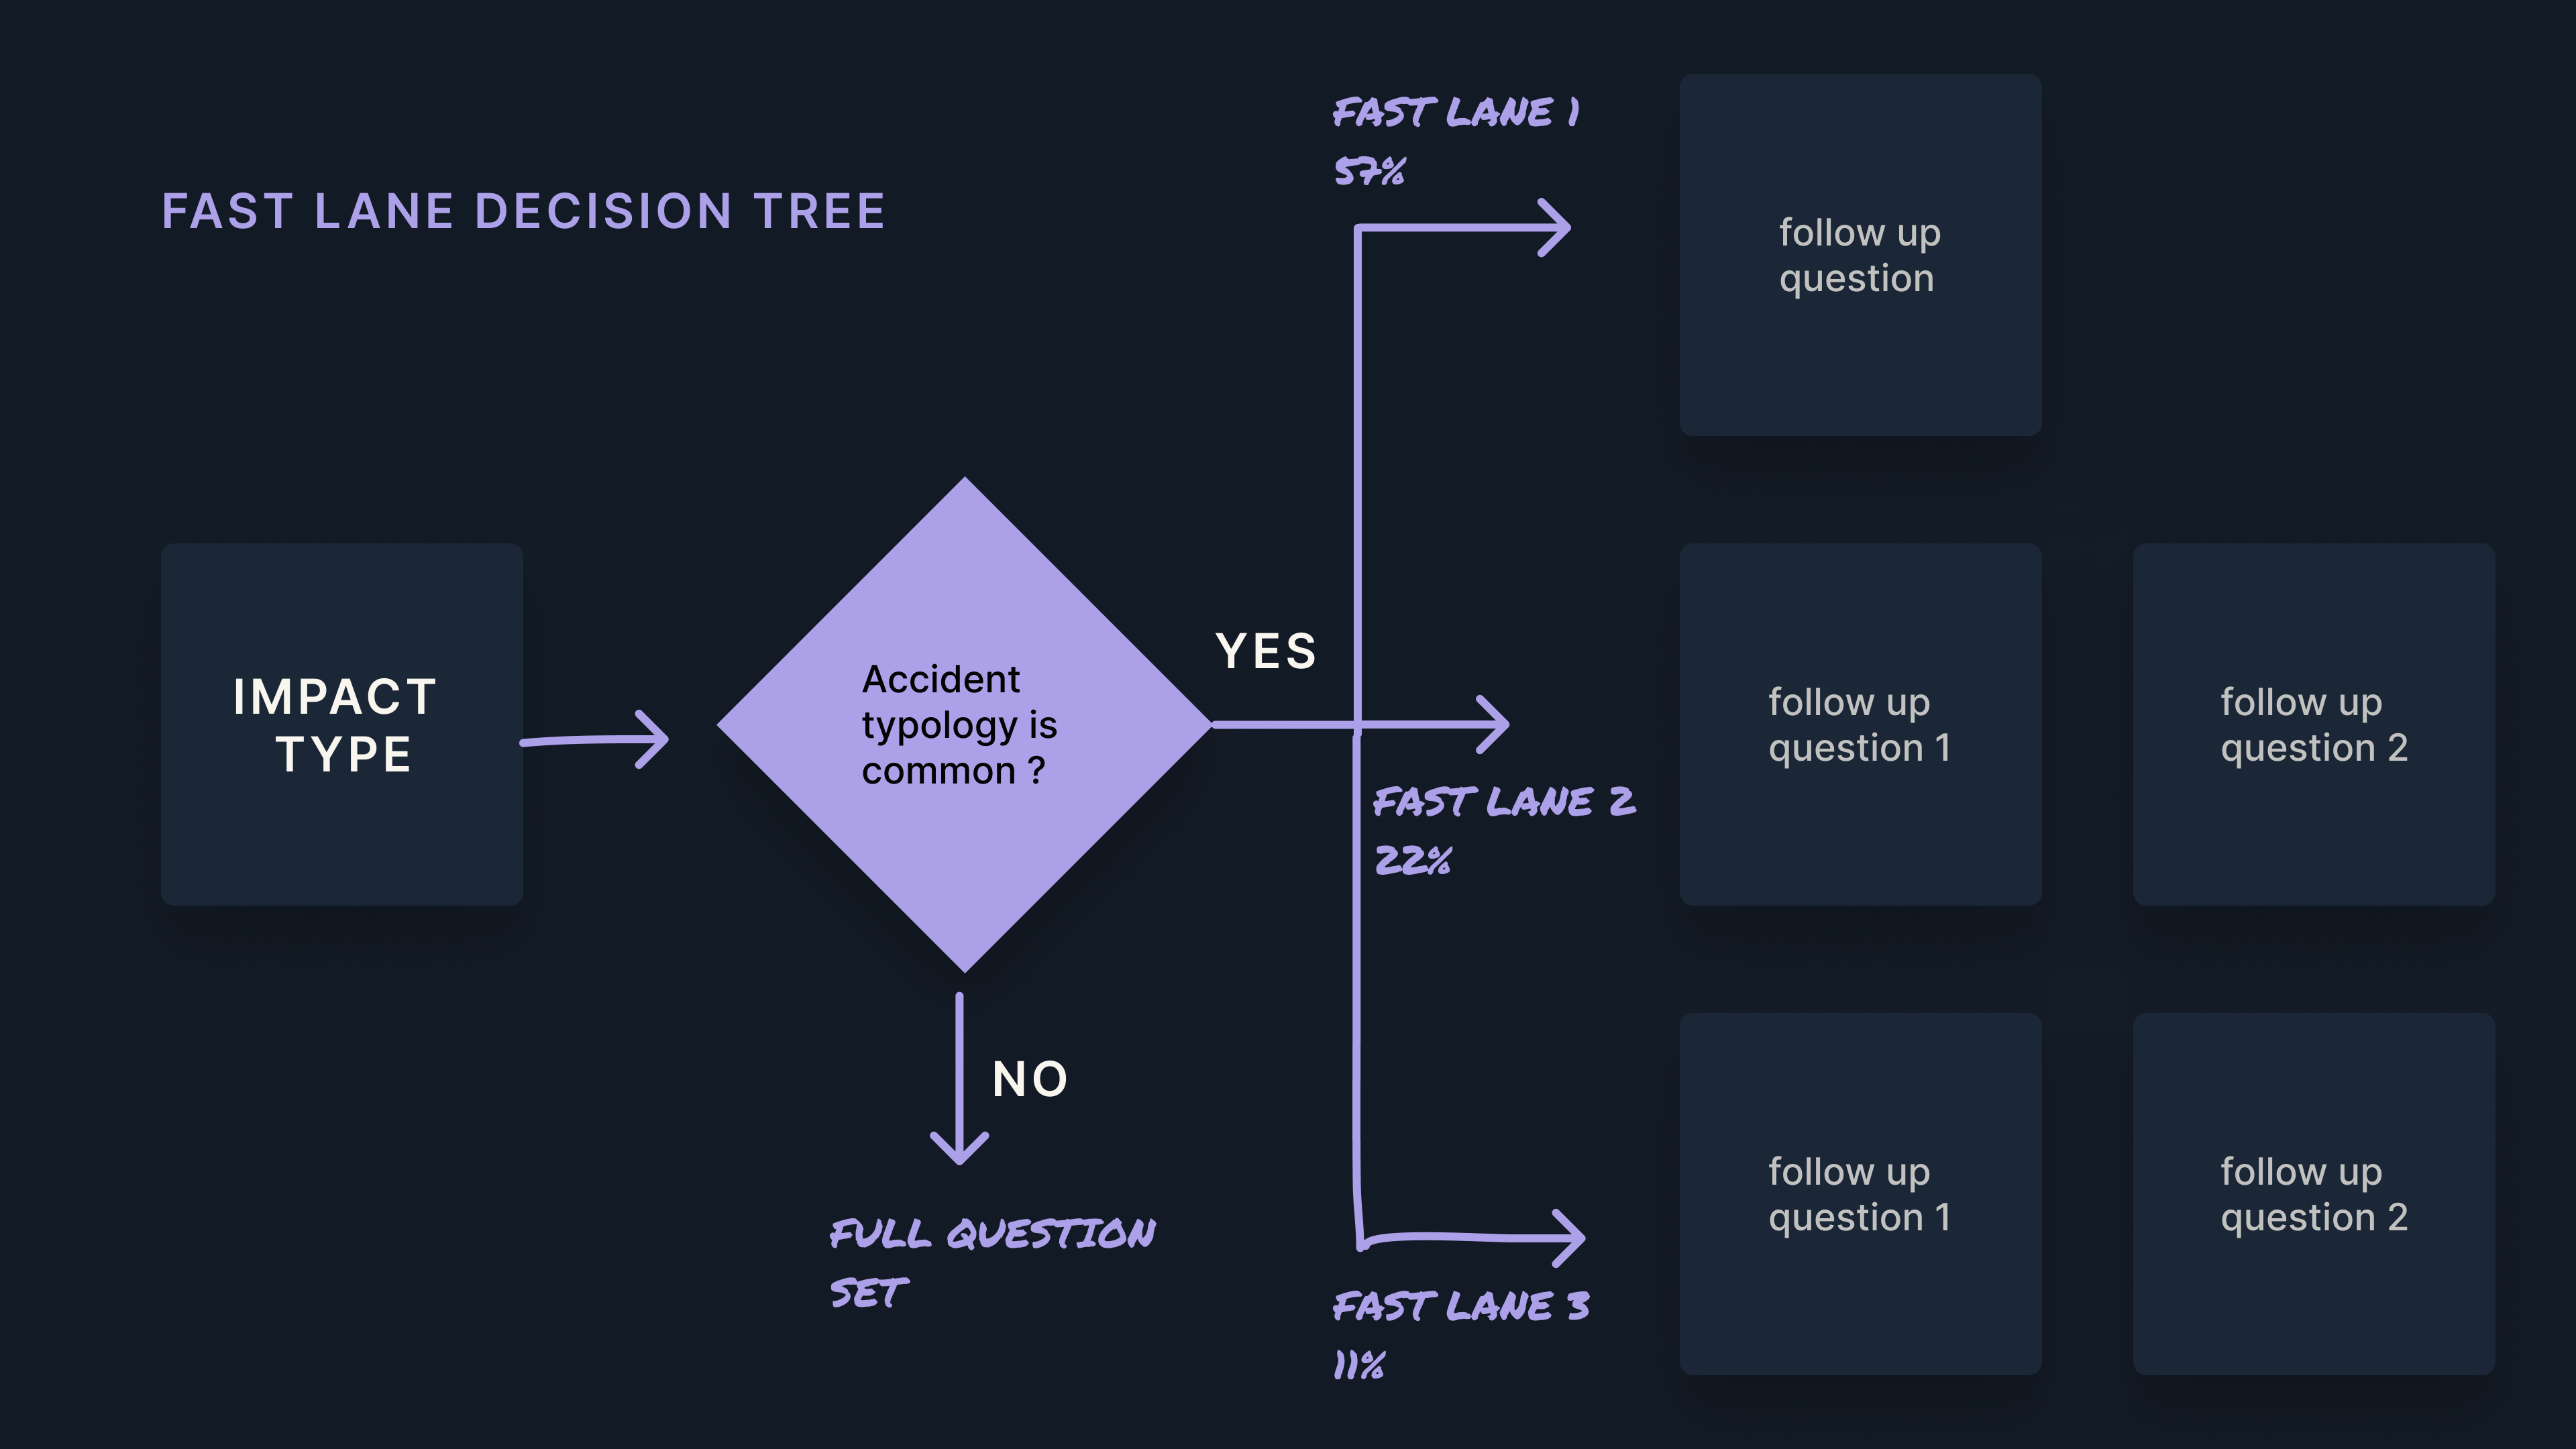
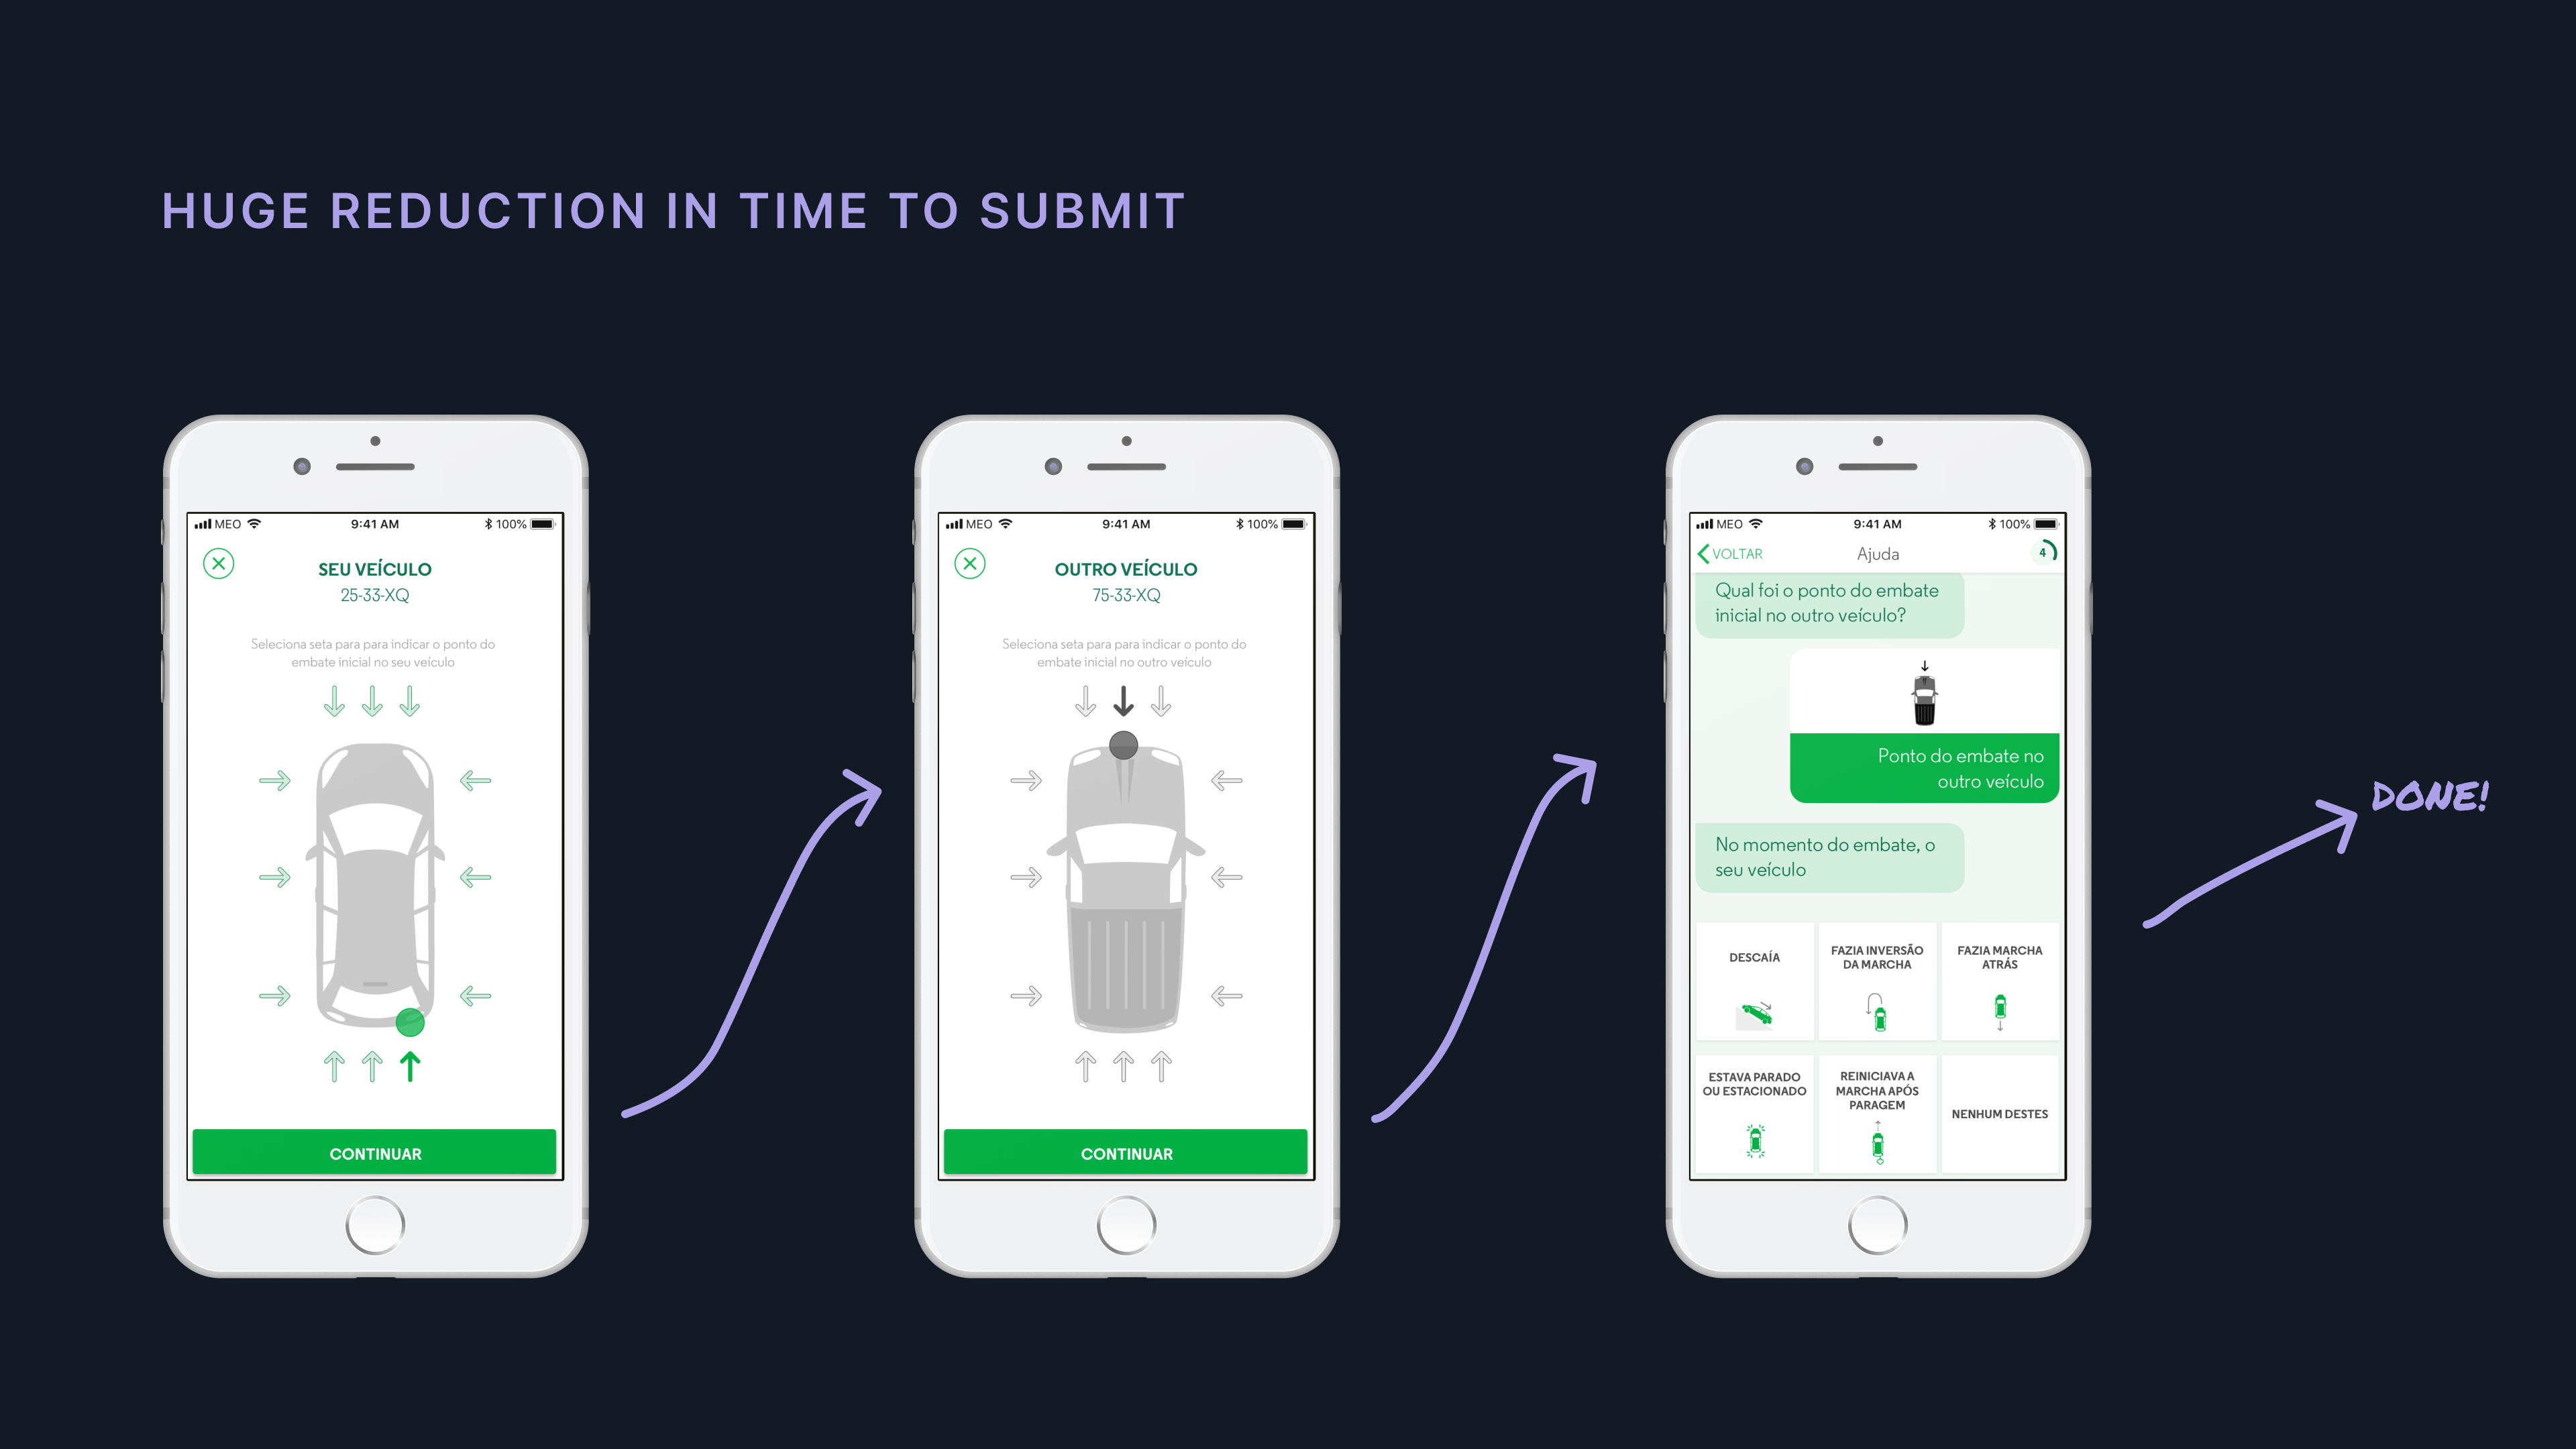
Over 90% of accidents were inferred with up to two questions!
By inferring the accident typology based on how the vehicles had impacted each other, and then following up with a single question, we were able to detect over 90% of the accident types — allowing us to skip over all the remaining questions.
By reframing the chatbot conversation to be based on the accident typology, connecting it to the claims process was immensely simplified. Every accident typology has a direct, predefined correlation to driver responsibility — in other words, ‘whose fault it was’.
By connecting this to the accident responsibility framework (a shared legal agreement between all insurance providers), our chatbot could essentially determine what happened and who ‘caused the accident’. This practically automated the entire claims process for our client, Tranquilidade!
Reflections
Designing the DAD for Tranquilidade was a milestone project in my career, with insightful lessons for my design practice. The months of research allowed us to understand the whole problem space deeply, and workshops with the customer journey maps enabled us to build consensus with our stakeholders. Towards the end, we all truly felt like we had co-created this solution!
The other main takeaway for me was how we used data to inform our design decisions. Today this is trivial, but back in 2018 this project gave me a glimpse of how studying and interpreting data can truly supercharge a design process 🤓.